

The Quick Facts
- October rewarded diversification. Value stocks, defensive sectors, and bonds advanced, helping offset weakness in technology and growth stocks.
- Growth portfolios (70% Global Equity / 30% U.S. Aggregate bond) declined 0.4% in October and are up 7.7% year-to-date and 8.6% over the past twelve months.
- The S&P 500 declined 0.9%, the Nasdaq 100 fell 6.6%, and the Russell 2000 gained 0.6%. Russell 1000 Value gained 4.4%, while Russell 1000 Growth declined 6.1%.
- The Federal Reserve held rates at 3.75% to 4.00% as inflation remained elevated. Two officials preferred another increase.
- The 10-year Treasury yield fell from 5.28% to 4.93%, while the 2-year yield declined from 4.89% to 4.59%. Both remained above year-end 2025 levels.
- The U.S. Aggregate Bond Index gained 2.4%, while investment-grade corporate and municipal bonds returned 2.2% and 3.9%, respectively. All three remained negative year-to-date.
October Asset Class Performance
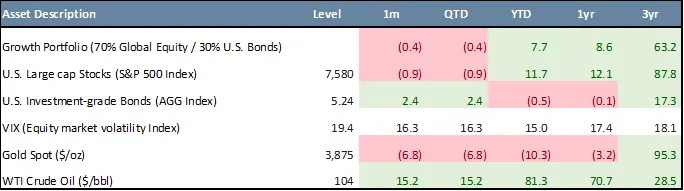
October brought a sharp rotation in market leadership. Technology and Communication Services declined, while value stocks, defensive sectors, and Energy advanced. Bonds recovered as Treasury yields fell, helping cushion losses in global equities. A traditional 70% Global Equity / 30% U.S. Aggregate bond portfolio declined 0.4% during the month and is up 7.7% year-to-date and 8.6% over the past twelve months.
Economic releases during October showed resilient growth alongside subdued hiring. The initial estimate of third-quarter real GDP showed annualized growth of 3.4%, up from 2.2% in the second quarter, supported by investment, consumer spending, and government spending. However, September payrolls increased by just 29,000, while unemployment held at 4.2%. Economic growth continued to outpace the improvement in employment.
Inflation remained a concern. September CPI, released in October, increased 0.6% during the month and 3.7% over the previous year, with gasoline accounting for more than half of the monthly increase. The PCE price index rose 3.6% over the previous year, or 3.1% excluding food and energy. These readings highlighted the continuing challenge of returning inflation to the Federal Reserve’s 2% target.
The Federal Reserve held its policy rate at 3.75% to 4.00% at its October 28 meeting, following September’s increase. Policymakers described economic activity as expanding at a strong pace and emphasized that inflation remained elevated. Two officials preferred another rate increase, underscoring the continuing debate over how much additional tightening may be needed.
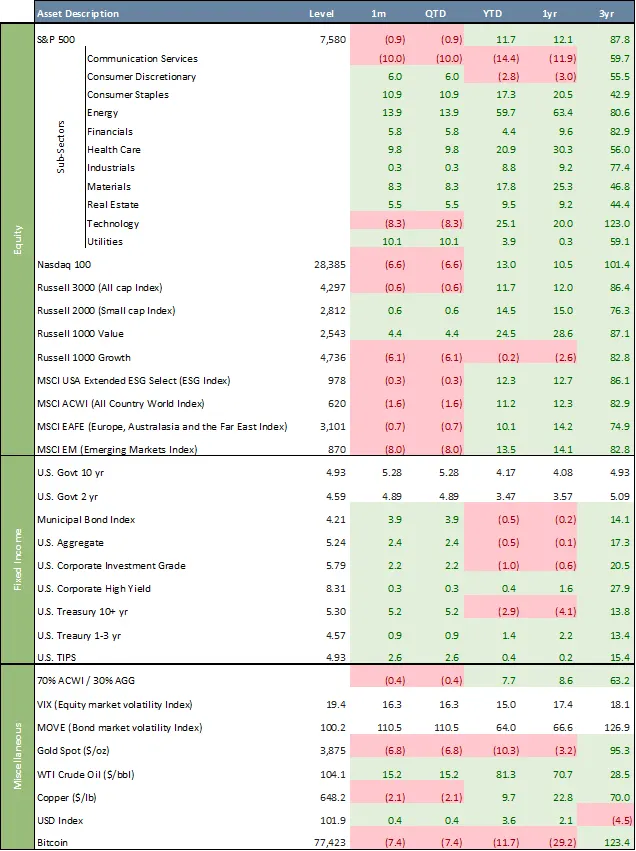
U.S. equities were mixed. The S&P 500 declined 0.9% in October but remains up 11.7% year-to-date. The Nasdaq 100 fell 6.6%, reducing its year-to-date gain to 13.0%. Small-cap stocks held up better, with the Russell 2000 gaining 0.6% during the month and bringing its year-to-date return to 14.5%.
The divergence between growth and value widened considerably. The Russell 1000 Value Index gained 4.4% in October, while the Russell 1000 Growth Index declined 6.1%. Value is now up 24.5% year-to-date, compared with a decline of 0.2% for growth.
Sector performance illustrated how much activity the headline index return concealed. Nine of the eleven S&P 500 sectors advanced. Energy led with a 13.9% gain, followed by Consumer Staples at 10.9%, Utilities at 10.1%, and Health Care at 9.8%. Materials gained 8.3%, Consumer Discretionary 6.0%, Financials 5.8%, and Real Estate 5.5%. In contrast, Communication Services fell 10.0%, and Technology declined 8.3%. Despite October’s setback, Technology remains up 25.1% year-to-date, while Energy leads with a 59.7% gain.
Corporate earnings continued to grow, but expectations proved demanding. As of October 30, with 60% of S&P 500 companies having reported, FactSet’s blended measure of reported and estimated third-quarter earnings growth stood at 30.2%. Nevertheless, disappointing results from several major technology-related companies intensified concerns about the financing and eventual returns from AI investment. Strong aggregate earnings growth did not prevent sharp losses where results fell short of expectations.
International equities also weakened. The MSCI ACWI declined 1.6% in October but remains up 11.2% year-to-date. The MSCI EAFE Index fell 0.7%, bringing its year-to-date return to 10.1%. Emerging markets experienced a sharper reversal, declining 8.0% during the month, although the MSCI Emerging Markets Index remains up 13.5% for the year.
Bond markets recovered part of September’s losses. The 10-year Treasury yield declined from 5.28% to 4.93%, while the 2-year yield fell from 4.89% to 4.59%. Both remained well above their year-end 2025 levels. The Bloomberg U.S. Aggregate Bond Index gained 2.4% in October, investment-grade corporate bonds returned 2.2%, and municipal bonds gained 3.9%. Longer-maturity Treasury bonds benefited most from falling yields, with the U.S. Treasury 10+ year index gaining 5.2%. High-yield corporate bonds advanced a more modest 0.3%.
The recovery narrowed, but did not eliminate, several year-to-date bond losses. The U.S. Aggregate and municipal bond indices are each down 0.5% for the year, while IG corporate bonds are down 1.0%. Bond-market volatility eased, with the MOVE Index declining from 110.5 to 100.2. Equity volatility moved in the opposite direction, with the VIX rising from 16.3 to 19.4.
Oil remained a significant macroeconomic pressure point. WTI crude gained 15.2% in October to $104 per barrel, bringing its year-to-date increase to 81.3%. Concerns about escalation in the U.S.-Iran conflict and an attack on a tanker in the Strait of Hormuz reinforced supply risks. In our view, sustained energy-price increases remain a risk to both inflation and household purchasing power.
Other commodities and digital assets weakened. Gold declined 6.8% to approximately $3,875 per ounce and is down 10.3% year-to-date. Copper fell 2.1% during the month but remains up 9.7% for the year. The U.S. Dollar Index gained 0.4%, bringing its year-to-date increase to 3.6%. Bitcoin declined 7.4% and is down 11.7% for the year.
October demonstrated the benefits of diversification across investment styles, sectors, and asset classes. Gains in value stocks and fixed income helped offset weakness in growth stocks and emerging markets. Looking ahead, the interaction between energy prices, inflation, interest rates, and corporate earnings remains central to the market outlook.
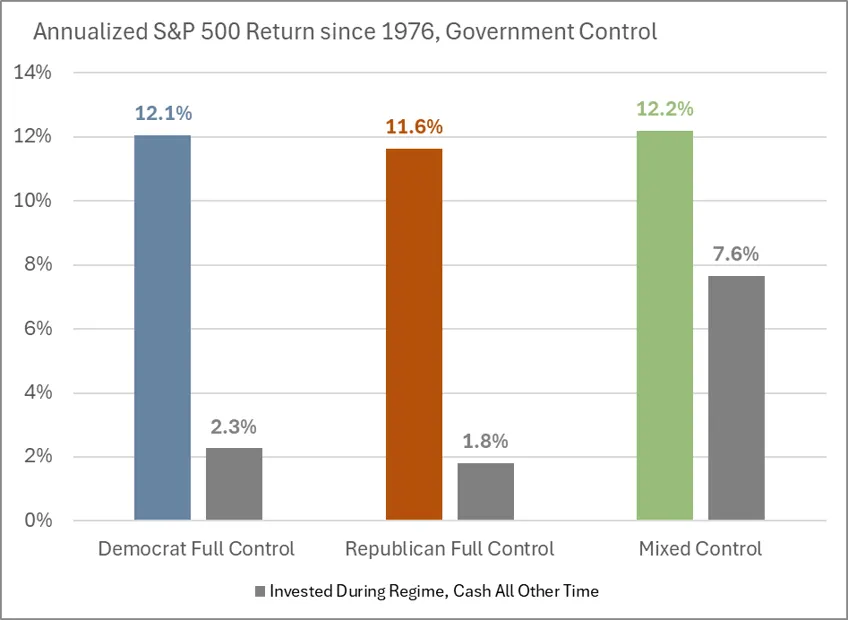
Chart of the Month – Annualized S&P 500 Return since 1976, Government Control
Political control can influence policy and create uncertainty, but history offers evidence that it does not provide a reliable signal for timing the stock market.
Since 1976, the annualized return of the S&P 500 Index was remarkably similar across the three government configurations shown: 12.1% under full Democratic control (9.8 years), 11.6% under full Republican control (8.1 years), and 12.2% under mixed control (31.9 years).
The chart also illustrates the cost of stepping out of the market. An investor who held stocks only during one of these government regimes and stayed in cash at other times earned significantly less: 2.3% under full Democratic control, 1.8% under full Republican control, and 7.6% under mixed control, which was also the most common.
The lesson is not that politics never matters. It is that party control alone has been a poor guide to long-term market returns. Over time, the price of money, shaped by Federal Reserve policy and the yield curve, and the growth of corporate earnings matter far more to equity values. Investors who stayed invested participated in the market’s growth across changing administrations and government configurations. This history suggests that election outcomes are a weak basis for major portfolio changes, especially when investment goals extend across multiple administrations.
Political outcomes can feel personal, especially when they affect issues we care deeply about. But we believe portfolio decisions are best guided by financial goals, time horizon, and tolerance for risk, rather than whether our preferred team has won or lost. Staying disciplined helps keep short-term emotions from driving long-term investment decisions.
Quote of the Month
“You do not want to have a political view in investing.” – Warren Buffett.
Major Asset Class Dashboard
urated by Julien Frazzo, Deputy Chief Investment Officer, and Michael G. Dow, CAIA, CFA, Chief Investment Officer.
Related Links
Beacon ‘Pointe of View’ – A Market Update October 2026
Important Disclosure: The information contained in this article is for general informational purposes only. Opinions referenced are as of the publication date and may be modified due to changes in the market or economic conditions and may not necessarily come to pass. Forward-looking statements cannot be guaranteed. Past performance is not a guarantee of future results. Beacon Pointe has exercised all reasonable professional care in preparing this information. The information has been obtained from sources we believe to be reliable; however, Beacon Pointe has not independently verified or attested to the accuracy or authenticity of the information. The discussions, outlook, and viewpoints featured are not intended to be investment advice and do not consider specific investment objectives or risk tolerance you may have. All investments involve risks, including the loss of principal. Consult your financial professional for guidance specific to your circumstances. This document has been prepared with the assistance of ChatGPT Enterprise, an AI-powered tool designed to enhance productivity and provide support in drafting, editing, and organizing content. ChatGPT Enterprise leverages advanced AI models to generate text based on user input. Although ChatGPT Enterprise generates original content based on user input, there is a risk that the generated text may inadvertently resemble existing works that may not be properly cited. AI‑assisted content is reviewed by Beacon Pointe personnel for accuracy, completeness, and compliance.