
The Quick Facts
- Balanced portfolios posted a modest setback in June, declining 0.5%, but remained firmly positive at +8.1% year-to-date and +17.7% over one year.
- U.S. equities were mixed following the strong April-May rebound. The S&P 500 fell 1.0% in June but remained up 10.2% year-to-date, while the Nasdaq 100 slipped just 0.1% and held a 20.3% year-to-date gain.
- Leadership rotated beneath the surface, with Industrials (+7.3%), Health Care (+6.6%), and Financials (+4.3%) outperforming, while Communication Services (-7.2%), Energy (-5.0%), and Consumer Discretionary (-2.8%) lagged.
- International equities were mixed but remained constructive overall. MSCI EAFE gained 0.1% in June and 9.9% year-to-date, while MSCI Emerging Markets fell 1.4% for the month but remained up 23.8% year-to-date.
- Fixed income delivered modest gains as Treasury yields edged higher. The U.S. Aggregate Bond Index gained 0.2% in June and 0.6% year-to-date, while High Yield bonds rose 0.3% and remained up 2.0% year-to-date.
- June market sentiment was shaped by the Fed holding rates steady, Iran-related geopolitical risk, the high-profile SpaceX IPO, and sharp monthly declines in gold, oil, and Bitcoin.
* * *
Balanced portfolios experienced a modest setback in June, even as the strong second-quarter rebound remained intact. A traditional 70% global equity / 30% U.S. Aggregate bond portfolio declined 0.5% for the month, but still gained 10.6% for the quarter and 8.1% year-to-date.[1] The month was shaped by several crosscurrents: the Federal Reserve held interest rates steady at its June meeting, geopolitical tensions around Iran continued to influence energy markets, and the highly anticipated SpaceX IPO became a major micro-level event for investor sentiment and growth-stock risk appetite. The Fed maintained the federal funds target range at 3.50% to 3.75%, while acknowledging that economic activity remained solid despite elevated uncertainty related in part to the Middle East conflict.
June Asset Class Performance
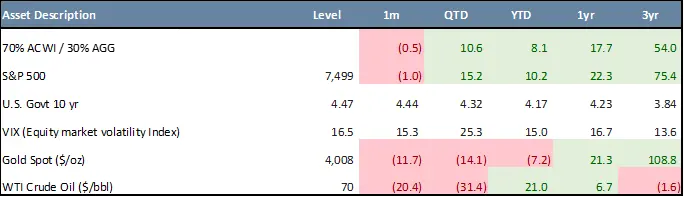
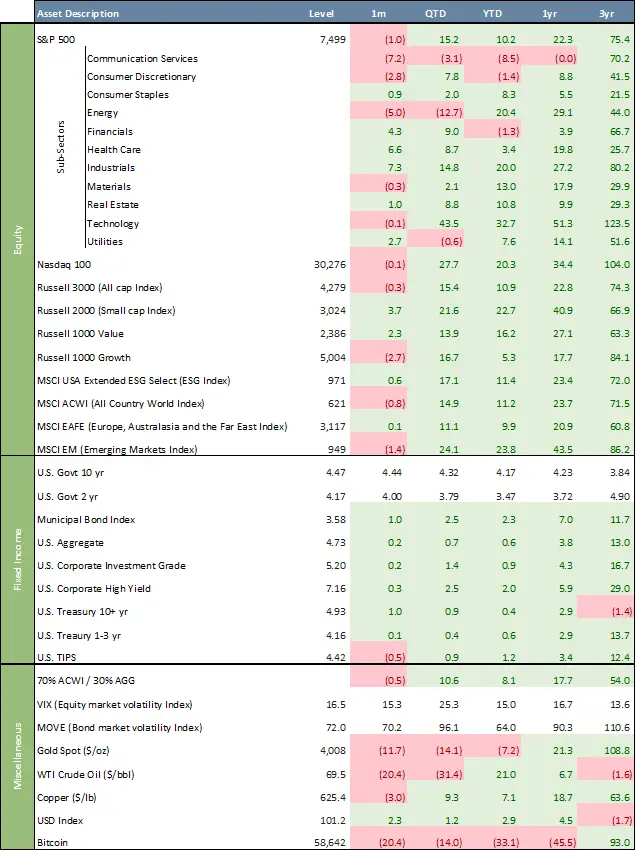
After April and May’s powerful recovery, equity markets were more mixed in June. The S&P 500 declined 1.0% for the month, though it remained up 10.2% year-to-date and 15.2% for the quarter. The Nasdaq 100 was nearly flat, slipping 0.1% in June, but continued to lead major U.S. equity benchmarks with a 20.3% year-to-date gain and a 27.7% quarterly advance. Technology remained the dominant leadership sector, essentially flat in June but up 32.7% year-to-date and 43.5% for the quarter. The SpaceX IPO, which priced on June 11 and traded up 19.2% on its first day, was followed by significant post-IPO volatility, added to the market’s focus on mega-cap innovation, private-to-public growth companies, and valuation discipline in high-profile technology-adjacent listings.
Sector performance showed a clear rotation beneath the surface. Industrials gained 7.3% in June and are now up 20.0% year-to-date, while Health Care rose 6.6% and Financials advanced 4.3%. Defensive areas also held up, with Utilities gaining 2.7% and Consumer Staples rising 0.9%. In contrast, Communication Services fell 7.2%, Energy declined 5.0%, and Consumer Discretionary dropped 2.8%. Despite June weakness, Energy remains up 20.4% year-to-date, reflecting the lingering impact of earlier oil-market disruptions tied to the Iran conflict and Strait of Hormuz concerns. WTI crude fell sharply in June, declining 20.4% to $69.50 per barrel, as supply conditions improved and prices retraced much of the geopolitical risk premium that had built earlier in the year.
Small-cap stocks were a notable bright spot. The Russell 2000 gained 3.7% in June and is now up 22.7% year-to-date, outperforming large-cap U.S. equities on a year-to-date basis. Value also outperformed growth during the month, with the Russell 1000 Value Index rising 2.3% compared with a 2.7% decline for the Russell 1000 Growth Index. However, growth continues to hold a longer-term advantage, with the Russell 1000 Growth Index up 84.1% over the past three years versus 63.3% for the Russell 1000 Value Index.
International equities were mixed but remain strong year-to-date. The MSCI ACWI declined 0.8% in June but is up 11.2% year-to-date, while developed international equities, represented by the MSCI EAFE Index, gained 0.1% for the month and 9.9% year-to-date. Emerging markets declined 1.4% in June but remained among the strongest major equity categories, with the MSCI EM Index up 23.8% year-to-date and 24.1% for the quarter. International markets continued to benefit from improved global risk appetite, though the stronger U.S. dollar in June created a modest headwind.
Fixed income returns were generally positive but modest, as Treasury yields moved slightly higher. The 10-year Treasury yield ended June at 4.47%, up from 4.44% at the end of May, while the 2-year Treasury yield rose to 4.17% from 4.00%. The Bloomberg U.S. Aggregate Bond Index gained 0.2% in June and is up 0.6% year-to-date. Municipal bonds were stronger, returning 1.0% for the month and 2.3% year-to-date. Investment Grade Corporates gained 0.2%, while High Yield bonds rose 0.3%. Longer-duration Treasuries also posted positive returns, with the U.S. Treasury 10+ Year Index gaining 1.0% in June, though it remains up only 0.4% year-to-date. Chairman Kevin Warsh’s first June FOMC decision reinforced the view that policy is likely to remain restrictive until inflation risks are more clearly contained, while his more data-dependent and less forward-guidance-oriented communication style added to debate over the Fed’s longer-term policy direction.
Commodity performance was broadly weaker in June. Gold fell 11.7% to $4,008 per ounce and is now down 7.2% year-to-date, though it remains up 21.3% over the past year and 108.8% over three years. WTI crude oil declined 20.4% to $69.50 per barrel, bringing its quarterly decline to 31.4%, despite remaining up 21.0% year-to-date. Copper fell 3.0% in June but is still up 7.1% year-to-date and 63.6% over three years. The U.S. Dollar Index rose 2.3% during the month to 101.2, supported by higher relative U.S. yields and safe-haven demand. Bitcoin declined 20.4% in June and is now down 33.1% year-to-date, underscoring renewed pressure across speculative assets.
Market volatility remained contained despite elevated headline risk. The VIX ended June at 16.5, up from 15.3 at the end of May but still well below levels seen earlier in the year. The MOVE Index, a measure of bond-market volatility, finished at 72.0, only modestly above its May level. Overall, June was a consolidation month following a strong second-quarter rally. While geopolitical uncertainty, Fed policy, commodity volatility, and high-profile IPO activity introduced new risks, diversified portfolios remained firmly positive for the quarter and year-to-date.
Chart of the Month – Stock-Bond Rolling 3-Year Correlation, Rolling 3 Year Core CPI
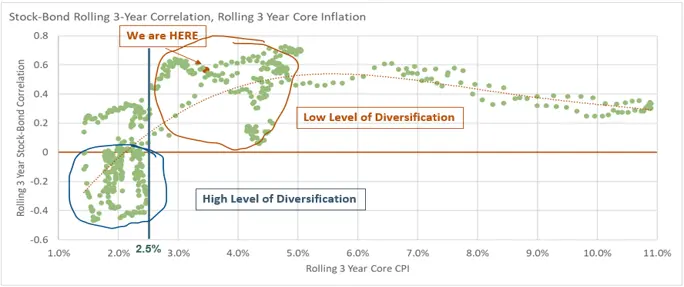
Historically, the diversification benefits of a traditional stock-bond portfolio have been strongest during periods of low and stable inflation. When 3-year rolling Core Consumer Price Index (“Core CPI”) remains below approximately 2.5%, stock and bond returns have often exhibited a negative correlation, meaning bonds have tended to provide a cushion when equity markets decline. This environment was characteristic of much of the post-Global Financial Crisis period and contributed significantly to the success of the traditional 60/40 portfolio.
As inflation rises above the 2.5% threshold, however, the relationship between stocks and bonds begins to change. Higher inflation often becomes the dominant driver of both asset classes, leading to a more positive correlation between equity and fixed income returns. In these periods, rising interest rates and inflationary pressures can negatively impact both stocks and bonds simultaneously, reducing the effectiveness of bonds as a portfolio diversifier.
The current environment remains consistent with this higher-inflation regime. With rolling core inflation still above historical levels associated with strong stock-bond diversification, investors should recognize that the traditional relationship between equities and fixed income may not provide the same level of downside protection experienced during the low-inflation era. As a result, relying solely on stocks and bonds may leave portfolios more exposed to common macroeconomic risks.
This backdrop highlights the potential value of incorporating alternative investments into a diversified portfolio. Asset classes such as private credit, private equity, real assets, infrastructure, hedge funds, and other non-traditional strategies may offer return drivers that are less dependent on the same factors influencing public stocks and bonds. When stock-bond correlations are elevated, alternatives may help broaden sources of return, improve diversification, and enhance overall portfolio resilience.[2]
Quote of the Month
“The future is uncertain; therefore, the best strategy is to own assets that respond differently to different economic environments.” — Ray Dalio
Major Asset Class Dashboard
Curated by Julien Frazzo, Deputy Chief Investment Officer, and Michael G. Dow, CAIA, CFA®, Chief Investment Officer.
[1] The 70/30 balanced portfolio is a hypothetical index blend and does not represent an actual Beacon Pointe portfolio. Indexes are unmanaged, cannot be invested in directly, and do not reflect fees, expenses, or taxes.
[2] Alternative investments, including funds that invest in alternative investments, are risky and may not be suitable for all investors. Alternative investments often employ leveraging and other speculative practices that increase an investor’s risk of loss to include complete loss of investment, often charge high fees, and can be highly illiquid and volatile.
Related Links
Beacon ‘Pointe of View’ – A Market Update June 2026
Macro & Markets: May 2026 – An Update from Beacon Pointe CIO
Important Disclosure: The information contained in this article is for general informational purposes only. Opinions referenced are as of the publication date and may be modified due to changes in the market or economic conditions and may not necessarily come to pass. Forward-looking statements cannot be guaranteed. Past performance is not a guarantee of future results. Beacon Pointe has exercised all reasonable professional care in preparing this information. The information has been obtained from sources we believe to be reliable; however, Beacon Pointe has not independently verified or attested to the accuracy or authenticity of the information. The discussions, outlook, and viewpoints featured are not intended to be investment advice and do not consider specific investment objectives or risk tolerance you may have. All investments involve risks, including the loss of principal. Consult your financial professional for guidance specific to your circumstances. This document has been prepared with the assistance of ChatGPT Enterprise, an AI-powered tool designed to enhance productivity and provide support in drafting, editing, and organizing content. ChatGPT Enterprise leverages advanced AI models to generate text based on user input. Although ChatGPT Enterprise generates original content based on user input, there is a risk that the generated text may inadvertently resemble existing works that may not be properly cited. AI‑assisted content is reviewed by Beacon Pointe personnel for accuracy, completeness, and compliance.