The Quick Facts
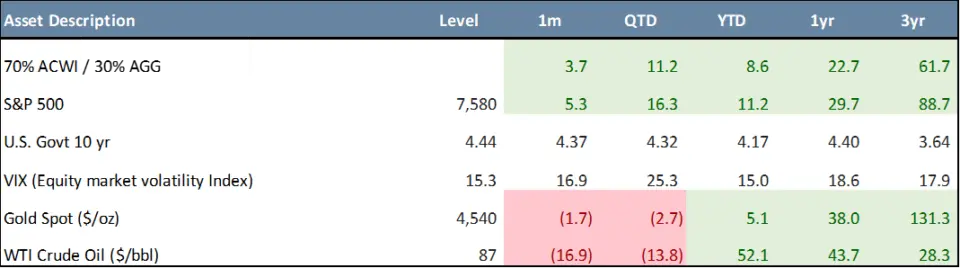
- Balanced investors benefited from a rally across both stocks and bonds in May, with a traditional 70% global equity / 30% U.S. Aggregate bond portfolio gaining 3.7% for the month, bringing year-to-date returns to 8.6% and one-year returns to 22.7%.
- U.S. equities extended April’s rebound, with the S&P 500 gaining 5.3% in May (+11.2% YTD and +29.7% over one year), while the Nasdaq 100 advanced 10.6% (+20.5% YTD), supported by strong earnings, AI enthusiasm, and large-cap growth leadership.
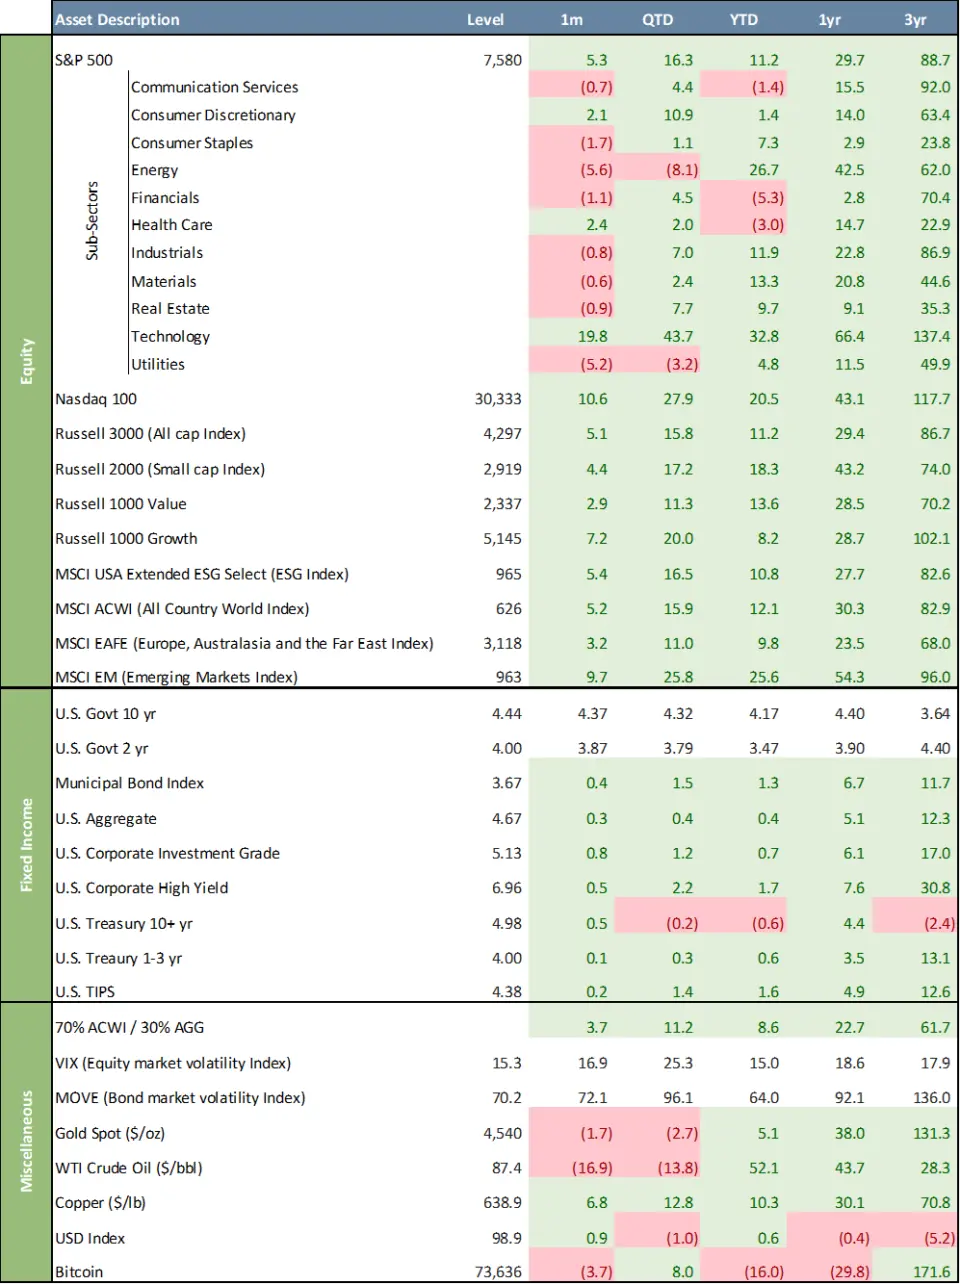
- Sector leadership remained concentrated in growth-oriented areas, with Technology surging 19.8% in May (+32.8% YTD), while Energy (-5.6%) and Utilities (-5.2%) lagged.
- International equities participated in the global rally, with the MSCI Europe, Australasia and the Far East (“EAFE”) Index rising 3.2% in May (+9.8% YTD) and the MSCI Emerging Markets (“EM”) Index advancing 9.7% (+25.6% YTD).
- Fixed income delivered modestly positive results as yields remained relatively stable, with the 10-year Treasury ending May at 4.44%, the U.S. Aggregate Bond Index gaining 0.3% for the month (+0.4% YTD), and High Yield bonds advancing 0.5% (+1.7% YTD).
* * *
Balanced investors continued to benefit from the broad recovery across both stocks and bonds during May. A traditional 70% global equity / 30% U.S. Aggregate bond portfolio gained 3.7% for the month, bringing its year-to-date return to 8.6%. While equity markets remained the primary driver of returns, positive performance across most major asset classes helped support diversified portfolios and reinforced the benefits of maintaining strategic allocations through periods of market volatility.
After April’s powerful rebound, markets extended their advance in May as investors grew increasingly confident that the worst of the first-quarter volatility was behind them. Strong corporate earnings, continued enthusiasm surrounding AI, and easing geopolitical concerns helped support risk assets. U.S. equities delivered another strong month, led once again by large-cap growth stocks.
May Asset Class Performance
The S&P 500, propelled by 11 all-time closing highs, gained 5.3% in May, bringing its year-to-date return to 11.2% and extending its one-year gain to 29.7%. The Nasdaq 100 advanced 10.6% during the month and is now up 20.5% year-to-date, benefiting from continued strength in mega-cap technology and AI-related companies. Sector leadership remained concentrated in growth-oriented areas. Technology surged 19.8% in May and is now up 32.8% year-to-date, far outpacing all other sectors. Consumer Discretionary (+2.1%) and Health Care (+2.4%) also posted gains. Energy was the primary laggard, declining 5.6% during the month but up 26.7% year-to-date.
International equities continued to participate in the global rally. Developed international markets, represented by the MSCI EAFE Index, gained 3.2% in May and are now up 9.8% year-to-date. Emerging markets remained among the strongest-performing major equity segments, with the MSCI Emerging Markets Index advancing 9.7% during the month and 25.6% year-to-date, supported by improving economic conditions across several key emerging economies and continued investor appetite for higher-growth regions. Smaller-cap equities also posted solid gains, with the Russell 2000 Index rising 4.4% in May and extending its year-to-date return to 18.3%. Within U.S. style segments, both value and growth stocks participated in the market advance. The Russell 1000 Value Index gained 2.9% during May and is now up 13.6% year-to-date, while the Russell 1000 Growth Index advanced 7.2% for the month and 8.2% year-to-date. Over the past three years, Growth has outperformed Value by 31.9%, returning 102.1% versus 70.2%. The ESG segment, as measured by the MSCI USA Extended ESG Select Index, gained 5.4% in May and is now up 10.8% year-to-date, modestly trailing the S&P 500’s 11.2% year-to-date return. Over the past three years, the ESG index has appreciated 82.6%, underperforming the S&P 500 by 6.2%. International equities broadly benefited from improving investor sentiment and a supportive global growth backdrop, with both developed and emerging market stocks contributing positively to diversified portfolios.
Fixed income delivered modestly positive results as Treasury yields remained relatively stable. The 10-year Treasury yield ended May at 4.44%, up slightly from 4.37% at the end of April, while the 2-year Treasury yield finished at 4.00%. Within core bonds, the Bloomberg U.S. Aggregate Bond Index gained 0.3% in May and 0.4% year-to-date. Municipal bonds returned 0.4% during the month and are up 1.3% year-to-date. Investment Grade Corporates advanced 0.8% in May, bringing their year-to-date gain to 0.7%, while High-Yield bonds returned 0.5% and are up 1.7% year-to-date. Longer-duration Treasuries continued to face headwinds from higher rates, with the U.S. Treasury 10+ Year Index gaining 0.5% in May but remaining down 0.6% year-to-date. While there was no Federal Reserve (“Fed”) meeting in May, interest rate expectations continued to shift as inflation remained stubbornly above target and economic activity stayed resilient. Markets are now overwhelmingly pricing a hold at the June FOMC (“Federal Open Market Committee”) meeting, with futures implying that the Fed may remain on the sidelines for the balance of the year. Notably, investors have increasingly reduced expectations for additional rate cuts, and futures markets are now assigning meaningful probabilities to the possibility of another rate hike before year-end should inflation fail to moderate. As a result, the policy conversation has shifted away from the timing of future easing and toward how long rates may need to remain restrictive in order to bring inflation back toward the Fed’s long-term target.
Commodity performance was mixed. WTI crude oil declined 16.9% in May to $87.40 per barrel, though it remains up 52.1% year-to-date following its dramatic first-quarter surge. Gold fell 1.7% during the month to $4,540 per ounce but remains ahead 5.1% year-to-date. Industrial metals were stronger, with copper gaining 6.8% in May and 10.3% year-to-date, reflecting ongoing optimism surrounding infrastructure spending, electrification trends, and AI-related demand for data center construction. The U.S. Dollar Index rose 0.9% during May to 98.9, leaving it modestly positive on the year at 0.6%.
Market volatility continued to ease as investor sentiment improved. The Cboe Volatility Index (“VIX”) closed May at 15.3, down from 16.9 at the end of April and well below the elevated levels experienced during the first quarter. Continued earnings strength, resilient economic growth, and fading geopolitical fears have helped support risk assets. While inflation, fiscal deficits, and policy uncertainty remain important considerations, markets have entered the summer with considerable momentum and broad participation across most major asset classes.
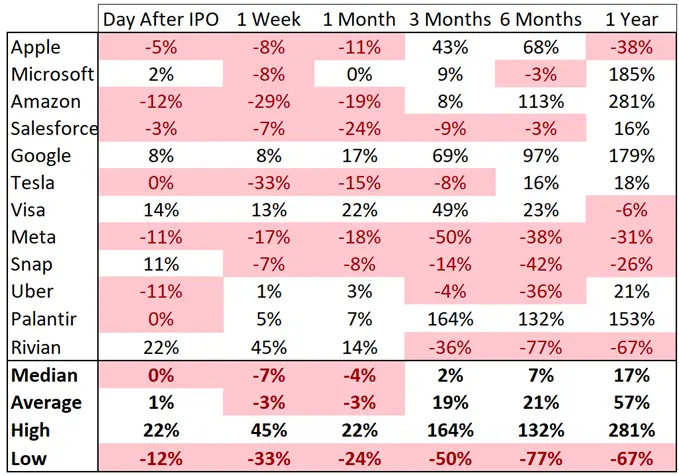
Chart of the Month – Select IPO Sample – Performance from Day after IPO
While upcoming IPOs from firms such as OpenAI, Anthropic, and SpaceX are likely to attract significant attention, the structural realities of IPO investing limit the ability of most investors to capture early-stage gains.
Pre-IPO access is constrained and costly, secondary markets are opaque, and IPO allocations favor institutions. Historical evidence suggests that IPO outcomes are highly variable, particularly in the technology sector. Since the mid-1990s, major technology IPOs have exhibited a recurring pattern: strong initial trading activity followed by volatile or negative short-term performance. When returns are measured from the first close after the IPO rather than from the IPO price, median one-year returns in this sample fall from 47% to 17%, while average one-year returns decline from 91% to 57%. Importantly, these results are based on a small subsample of large, well-known IPOs and therefore likely overstate the performance of the broader IPO universe because of survivorship and selection bias.
IPOs often exhibit “first-day pops,” averaging around 15–20%, but these gains primarily accrue to institutional investors who receive shares at the offer price. Private clients typically purchase shares after trading begins, often at elevated prices, exposing them to higher risk and lower long-term returns. Historical evidence shows that IPOs tend to underperform the broader market over time. Studies by Ritter (1991) and Loughran and Ritter (1995) find that IPOs underperform comparable firms by roughly 20–30% over the three years following issuance. Returns are also highly skewed: while a small subset of IPOs generate exceptional gains, most lag the market, consistent with findings by Bessembinder (2018) that only a minority of stocks account for the majority of wealth creation.
An alternative approach is to wait until a company begins trading publicly and allow market forces to determine a fair price. Over time, successful companies are incorporated into major indices such as the S&P 500. For private clients, we believe a disciplined approach that emphasizes diversification and passive exposure remains the most effective strategy. Rather than pursuing early access, investors are often better served by allowing successful companies to enter public markets and become part of broad indices over time.
Quote of the Month
“An IPO is like a negotiated transaction — the seller chooses when to come public — and it’s unlikely to be a time that’s favorable to you.” — Warren Buffett
Major Asset Class Dashboard
Curated by Julien Frazzo, Deputy Chief Investment Officer, and Michael G. Dow, CAIA, CFA®, Chief Investment Officer.
Related Links
Macro & Markets: May 2026 – An Update from Beacon Pointe CIO
Beacon ‘Pointe of View’ – A Market Update May 2026
Important Disclosure: The information contained in this article is for general informational purposes only. Opinions referenced are as of the publication date and may be modified due to changes in the market or economic conditions and may not necessarily come to pass. Forward-looking statements cannot be guaranteed. Past performance is not a guarantee of future results. Beacon Pointe has exercised all reasonable professional care in preparing this information. The information has been obtained from sources we believe to be reliable; however, Beacon Pointe has not independently verified or attested to the accuracy or authenticity of the information. The discussions, outlook, and viewpoints featured are not intended to be investment advice and do not consider specific investment objectives or risk tolerance you may have. All investments involve risks, including the loss of principal. Consult your financial professional for guidance specific to your circumstances. This document has been prepared with the assistance of Microsoft Copilot, an AI-powered tool designed to enhance productivity and provide support in drafting, editing, and organizing content. Microsoft Copilot leverages advanced AI models to generate text based on user input. Although Copilot generates original content based on user input, there is a risk that the generated text may inadvertently resemble existing works that may not be properly cited.