
The Quick Facts
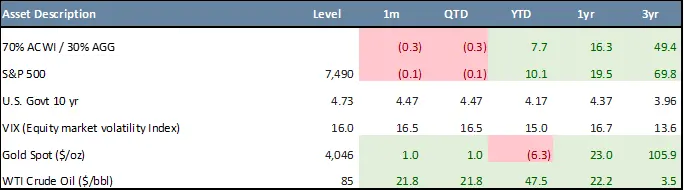
- Growth portfolios (70% Equity/30% Fixed Income) declined 0.3% in July but remained positive at +7.7% year-to-date and +16.3% over the past twelve months.
- U.S. equity performance masked a sharp rotation. The S&P 500 slipped just 0.1%, while the Nasdaq 100 fell 6.6% and the Russell 1000 Growth Index declined 4.8%.
- Value and economically sensitive sectors led, with Energy (+12.1%), Financials (+6.2%), and Consumer Staples (+2.4%) outperforming, while Technology (-8.0%), Industrials (-2.9%), and Utilities (-2.2%) lagged.
- International developed equities outperformed, with MSCI EAFE gaining 2.0% in July and 12.1% year-to-date. Emerging markets declined 3.1% but remained up 20.0% for the year.
- Fixed income weakened as Treasury yields moved higher. The U.S. Aggregate Bond Index fell 1.3% in July and was down 0.7% year-to-date, while longer-duration Treasuries declined 4.0%.
- July market sentiment was shaped by the Federal Reserve (“Fed”) holding rates steady, rising Treasury yields, a sharp increase in oil prices, renewed geopolitical concerns, and a significant rotation from growth toward value.
Growth-oriented portfolios gave back a modest portion of their recent gains in July as weakness in technology and fixed income offset strength in value-oriented equities, energy, and commodities. A traditional 70% Global Equity / 30% U.S. Aggregate bond portfolio declined 0.3% for the month but remained up 7.7% year-to-date and 16.3% over the past twelve months.1
The month was shaped by a sharp rotation away from growth stocks, rising Treasury yields, higher oil prices, and continued uncertainty surrounding inflation and Fed policy. At its July meeting, the Fed held the federal funds target range unchanged at 3.50% to 3.75%, while emphasizing that inflation remained above its 2% objective. Markets are now pricing in 1-2 quarter-point rate hikes by year-end, implying a federal funds rate near 4.00% in December.
July Asset Class Performance
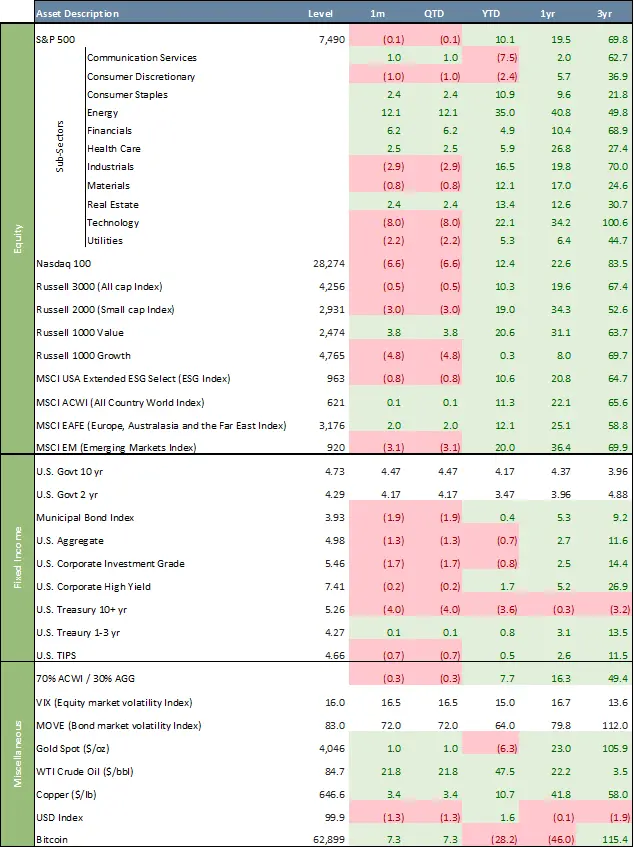
U.S. equity markets experienced substantial changes beneath relatively stable headline returns. The S&P 500 declined just 0.1% in July and remained up 10.1% year-to-date. However, the technology-heavy Nasdaq 100 fell 6.6%, while the Russell 1000 Growth Index declined 4.8%. Technology was the weakest sector, falling 8.0% as investors became more selective toward elevated valuations and continued AI-related capital spending. Despite the pullback, Technology remained up 22.1% year-to-date, 34.2% over the past twelve months, and 100.6% over three years. Sector performance showed a clear rotation toward value-oriented and economically sensitive areas. Energy gained 12.1% in July and was up 35.0% year-to-date, supported by sharply higher oil prices. Financials advanced 6.2%, while Consumer Staples, Health Care, and Real Estate gained 2.4%, 2.5%, and 2.4%, respectively. Communication Services rose 1.0%. In contrast, Industrials declined 2.9%, Utilities fell 2.2%, Consumer Discretionary lost 1.0%, and Materials declined 0.8%. The divergence reinforced the benefits of broad sector diversification as leadership shifted away from technology.
Small-cap stocks also weakened. The Russell 2000 declined 3.0% in July but remained up 19.0% year-to-date and 34.3% over the past twelve months. Value significantly outperformed growth, with the Russell 1000 Value Index gaining 3.8% compared with a 4.8% decline for the Russell 1000 Growth Index. Value was up 20.6% year-to-date versus only 0.3% for growth. Over three years, growth retained a modest advantage, rising 69.7% compared with 63.7% for value.
International developed equities outperformed both U.S. and emerging-market stocks. The MSCI EAFE Index gained 2.0% and was up 12.1% year-to-date and 25.1% over the past twelve months. Emerging markets declined 3.1% in July but remained up 20.0% for the year and 36.4% over the past twelve months. A weaker U.S. dollar provided some support to international assets, although emerging markets were pressured by the pullback in growth-oriented investments.
Fixed income returns were broadly negative as Treasury yields moved higher. The 10-year Treasury yield ended July at 4.73%, up from 4.47% at the end of June, while the 2-year yield increased to 4.29% from 4.17%. The Bloomberg U.S. Aggregate Bond Index declined 1.3% and was down 0.7% year-to-date. Municipal bonds fell 1.9%, investment-grade corporate bonds declined 1.7%, and high-yield bonds slipped 0.2%. Longer-duration Treasuries were particularly weak, falling 4.0% during the month and 3.6% year-to-date.
At its July meeting, the Fed held the federal funds rate unchanged at 3.50% to 3.75% for a fifth consecutive meeting. Policymakers continued to describe economic activity and labor-market conditions as solid but remained concerned that inflation was above the Fed’s 2% objective, with higher energy prices adding uncertainty. Three officials dissented in favor of a quarter-point increase, highlighting disagreement over whether policy was sufficiently restrictive. Chair Kevin Warsh reiterated the Fed’s commitment to restoring price stability while offering limited guidance on future moves, leaving markets focused on incoming inflation, employment, and growth data.
Commodity performance was broadly positive. WTI crude oil gained 21.8% to approximately $84.70 per barrel and was up 47.5% year-to-date. The increase reflected renewed geopolitical concerns and raised questions about the effect of higher energy costs on inflation, margins, and consumer spending. Gold gained 1.0% to approximately $4,046 per ounce but remained down 6.3% year-to-date, despite rising 23.0% over the past year and 105.9% over three years. Copper advanced 3.4% and was up 10.7% year-to-date.
The U.S. Dollar Index declined 1.3% in July to 99.9 but remained up 1.6% year-to-date. Bitcoin gained 7.3% during the month, although it remained down 28.2% for the year and 46.0% over the past twelve months. Equity-market volatility stayed relatively contained, with the VIX ending July at 16.0. Bond-market volatility increased more noticeably, with the MOVE Index rising from 72 to 83 as yields moved higher.
Overall, July showed how calm headline index returns can mask significant changes beneath the surface. Leadership shifted sharply from growth toward value, energy prices moved higher, and rising Treasury yields weighed on fixed income. Despite ongoing inflation, policy, and geopolitical risks, most major equity markets remained positive year-to-date, reinforcing the benefits of diversified allocations rather than reacting to short-term shifts in market leadership.
Chart of the Month – Contributors to Headline CPI Inflation
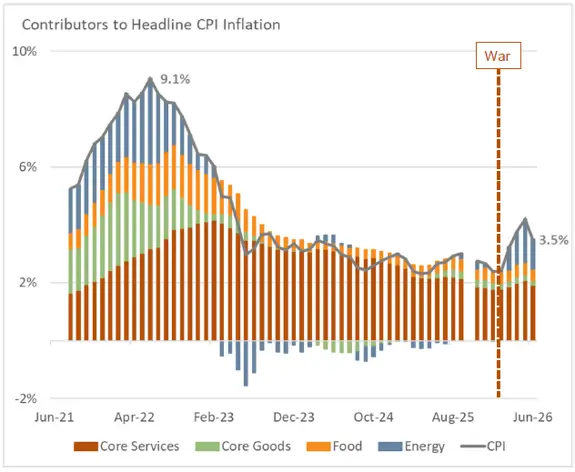
This month’s chart breaks headline Consumer Price Index (“CPI”) inflation into its major components—core services, core goods, food, and energy—to show where price pressures are coming from. During the 2021–2022 inflation surge, increases were broad-based, with supply-chain disruptions, rising food and energy costs, and stronger services inflation pushing headline CPI to a peak of 9.1% in June 2022.
Inflation later declined as supply chains normalized, goods prices stabilized, and energy costs eased. Core services, however, remained the largest and most persistent contributor. That progress was interrupted in the second quarter of 2026 by the closure of the Strait of Hormuz, which triggered a sharp global energy-price shock. As the chart shows, the resulting increase in energy costs pushed headline inflation to approximately 3.5% by June. The missing bars reflect a temporary lack of detailed inflation data during the government shutdown, when the agencies responsible for collecting and publishing the underlying CPI components were unable to operate normally.
The composition of the increase matters. Unlike the broad inflation surge of 2021 and 2022, the latest acceleration is concentrated primarily in energy, while core goods and food inflation remain relatively contained and services inflation continues to moderate. This suggests the increase may be less persistent, although prolonged energy disruption could eventually raise transportation, production, and distribution costs across the economy.
For the Federal Reserve, the key issue is whether the shock remains temporary or spreads into broader prices and inflation expectations. Policymakers may look through a one-time increase in energy costs, but a sustained pass-through into core inflation could delay rate cuts or require a more restrictive policy stance.
Quote of the Month
“It is not those who can inflict the most but those who can endure the most who will conquer.” – Terence MacSwiney
Major Asset Class Dashboard
Curated by Julien Frazzo, Deputy Chief Investment Officer, and Michael G. Dow, CAIA, CFA®, Chief Investment Officer.
1The 70/30 balanced portfolio is a hypothetical index blend and does not represent an actual Beacon Pointe portfolio. Indexes are unmanaged, cannot be invested in directly, and do not reflect fees, expenses, or taxes.
Related Links
Beacon ‘Pointe of View’ – A Market Update July 2026
Macro & Markets: August 2026 Registration – An Update from Beacon Pointe CIO
Important Disclosure: The information contained in this article is for general informational purposes only. Opinions referenced are as of the publication date and may be modified due to changes in the market or economic conditions and may not necessarily come to pass. Forward-looking statements cannot be guaranteed. Past performance is not a guarantee of future results. Beacon Pointe has exercised all reasonable professional care in preparing this information. The information has been obtained from sources we believe to be reliable; however, Beacon Pointe has not independently verified or attested to the accuracy or authenticity of the information. The discussions, outlook, and viewpoints featured are not intended to be investment advice and do not consider specific investment objectives or risk tolerance you may have. All investments involve risks, including the loss of principal. Consult your financial professional for guidance specific to your circumstances. This document has been prepared with the assistance of ChatGPT Enterprise, an AI-powered tool designed to enhance productivity and provide support in drafting, editing, and organizing content. ChatGPT Enterprise leverages advanced AI models to generate text based on user input. Although ChatGPT Enterprise generates original content based on user input, there is a risk that the generated text may inadvertently resemble existing works that may not be properly cited. AI‑assisted content is reviewed by Beacon Pointe personnel for accuracy, completeness, and compliance.