
The Quick Facts
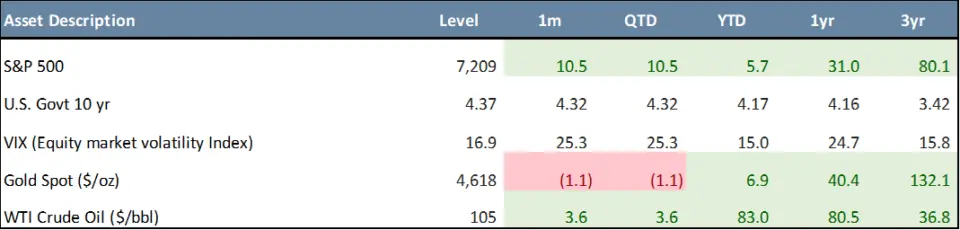
- U.S. equities rebounded sharply, with the S&P 500 gaining 10.5% in April (+5.7% YTD) and the Nasdaq 100 up 15.7% (+8.9% YTD), driven by strong mega-cap earnings, revived AI enthusiasm, and easing geopolitical tensions.
- International equities participated in the rally, with the MSCI Europe, Australasia, and Far East (“EAFE”) Index gaining 7.6% in April (+6.4% YTD) and the MSCI Emerging Markets (“EM”) Index surging 14.7% (+14.5% YTD), the strongest YTD performer among major equity benchmarks.
- Fixed income posted modest gains as yields remained broadly stable, with the 10-year Treasury closing April at 4.37% and the U.S. Aggregate (“AGG”) index gaining 0.1% in April, turning barely positive YTD (+0.1%).
- The Federal Reserve (“Fed”) held rates steady at 3.50–3.75% at its April 28–29 meeting amid “remaining elevated” inflation, with the March CPI print coming in at 3.3% year-over-year — the hottest reading since May 2024 — keeping policy uncertainty in focus.
- Commodities remained elevated, with WTI crude rising 3.6% in April to $105.10 per barrel (+83.0% YTD) as Strait of Hormuz disruption fears persisted, while gold edged down 1.1% but remained positive YTD (+6.9%).
* * *
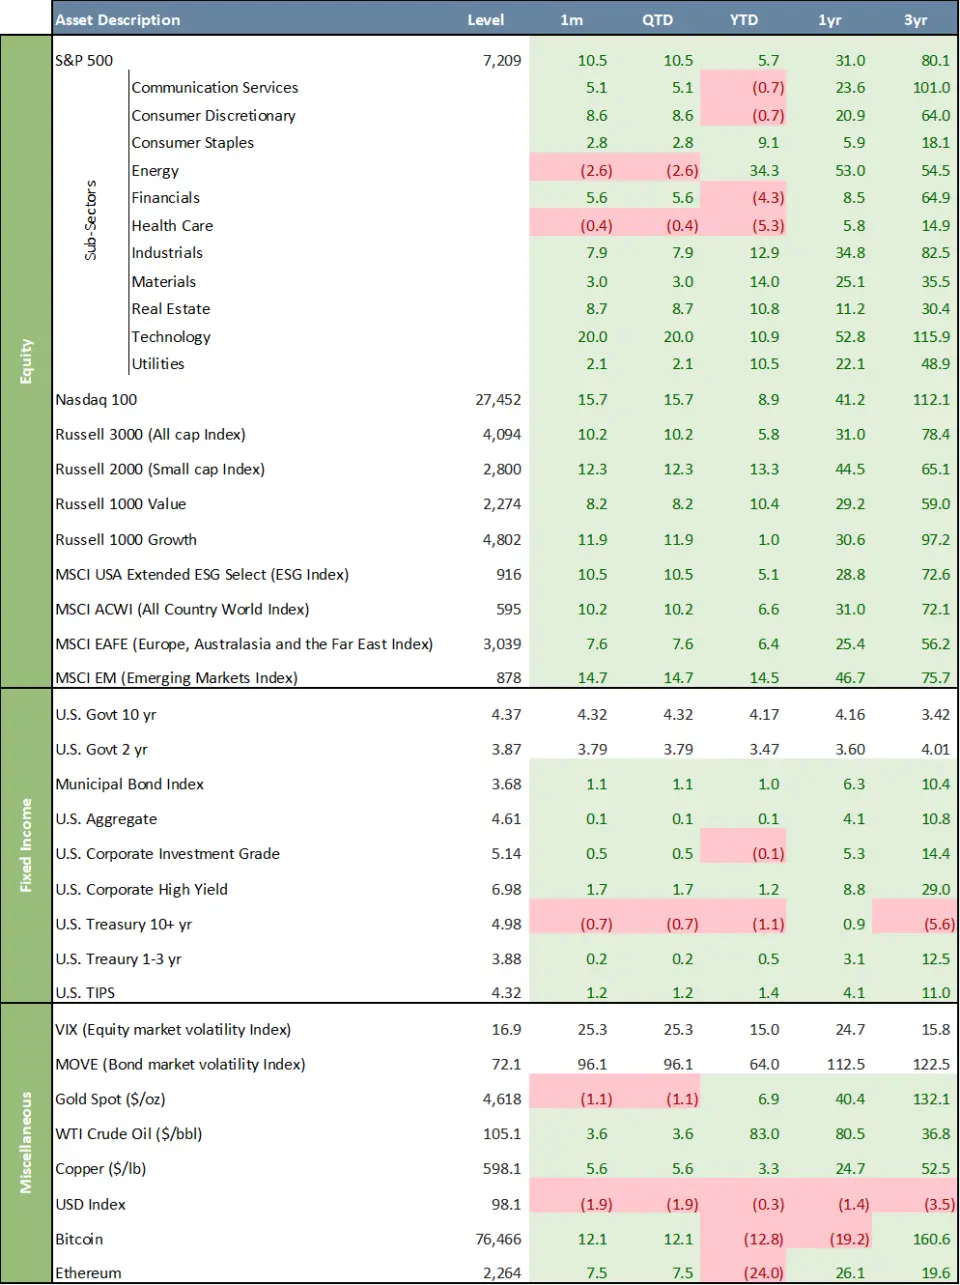
U.S. equities delivered a strong April rebound, with the S&P 500 posting its best monthly performance since November 2020, gaining 10.5% in April and pushing its year-to-date return to 5.7%. Investors were buoyed by resilient corporate earnings, revived enthusiasm around AI, and tentative progress toward a Middle East ceasefire. The Nasdaq recovered sharply, gaining 15.7% in April for a year-to-date gain of 8.9%, as pressure in software and semiconductor stocks eased and mega-cap earnings beat expectations. New S&P 500 record highs were reached by month-end, and several major indices had erased their year-to-date losses and then some. Performance beneath the surface remained highly dispersed. Technology was the clear standout, surging 20.0% in April and now up 10.9% year-to-date, as the AI investment narrative reasserted itself and mega-cap earnings beat expectations.
April Asset Class Performance
Industrials (+7.9%), Real Estate (+8.7%), and Financials (+5.6%) also contributed meaningfully to the recovery. Energy was a rare detractor, slipping 2.6% in April as oil pulled back from its March highs, though the sector retains a commanding 34.3% year-to-date lead. International Developed equities participated in the rally but trailed U.S. large caps, with the MSCI EAFE rising 7.6% in April and now up 6.4% year-to-date. The MSCI EM Index outperformed, gaining 14.7% in April and 14.5% year-to-date—the strongest YTD performer among major equity benchmarks—supported by a softer U.S. dollar and continued strength in commodity-linked and value sectors. Smaller caps showed strong resilience in April, with the Russell 2000 Index gaining 12.3% for the month and now up 13.3% YTD. Large Cap Value and Growth stocks both participated in the rally, with the Russell 1000 Value Index up 8.2% in April (+10.4% YTD), and the Russell 1000 Growth Index gaining 11.9% in April (+1.0% YTD). Over the past three years, Value has trailed Growth by 38.2%. The ESG segment, as measured by the MSCI USA Extended ESG Select Index, gained 10.5% in April (+5.1% YTD), 0.7% behind the S&P 500 on a YTD basis. Over three years, the ESG index appreciated 72.6%, underperforming the S&P 500 by 7.5%. International equities participated in the April rally, with the MSCI EAFE Index gaining 7.6% for the month and now up 6.4% YTD, while the MSCI EM Index was the strongest performer among major equity benchmarks, rising 14.7% in April and 14.5% YTD.
Fixed income improved modestly in April but remained challenging on a longer horizon. The 10-year Treasury yield ended the month at 4.37%, while the 2-year settled at 3.87%, both broadly stable relative to March quarter-end. The AGG gained just 0.1% in April and is barely positive year-to-date at +0.1%. Municipal bonds returned 1.1% for the month and 1.0% year-to-date. Investment Grade Corporates returned 0.5% in April but remain slightly negative on the year at -0.1%. High Yield was the standout within fixed income, gaining 1.7% in April and 1.2% year-to-date at a yield of 6.98%. At its April 28–29 meeting, the Fed left the policy rate unchanged at 3.50–3.75%, acknowledging that inflation is “remaining elevated” and attributing it in part to the energy shock. The meeting was notable for generating the largest number of dissenting votes in more than three decades: Eight members favored the hold with an easing bias intact, while three objected to that framing and one pushed for an immediate cut, underscoring the growing divisions within the committee. The March CPI print came in at 3.3% year-over-year—the hottest reading since May 2024—while core CPI held at 2.6% and core PCE at 3.0%, reinforcing the view that inflationary pressure remains concentrated at the headline rather than deeply embedded. The Fed flagged the Middle East situation as a continued source of uncertainty, signaling it will not adjust policy unless energy-driven price pressures prove persistent and broaden across the broader economy. For now, the Fed’s wait-and-see stance remains intact, though the unusually fractured vote and the looming leadership transition suggest the path forward on rates is far from settled.
On the macroeconomic front, April was defined by a broad recovery as investors grew increasingly comfortable looking past the Iran conflict. The combination of resilient earnings, revived AI enthusiasm, and tentative ceasefire progress produced broad-based gains across asset classes and a stronger month-end backdrop for most risk assets. The BEA’s advance estimate of Q1 2026 GDP showed the economy expanded at an annualized rate of 2.0%, a meaningful rebound from the 0.5% growth recorded in Q4 2025, with investment, exports, consumer spending, and government spending all contributing positively.
Commodities saw smaller moves than in Q1 during the month. WTI crude closed April at $105.10 per barrel, up 3.6% for the month and a striking 83.0% year-to-date, as Strait of Hormuz disruption fears kept a substantial geopolitical risk premium in place. Gold gave back 1.1% in April, settling at $4,618 per ounce, though it remains up 6.9% year-to-date. The U.S. Dollar Index edged down 1.9% for the month to 98.1, off 0.3% year-to-date as the safe-haven bid faded. Cryptocurrency markets were mixed, with Bitcoin rising 12.1% in April to $76,466 but remaining down 12.8% year-to-date, while Ethereum gained 7.5% in April but remained down 24.0% year-to-date. The VIX closed April at 16.9, down sharply from 25.3 at the March quarter-end, a clear signal that investor sentiment has stabilized materially. Four consecutive weeks of equity gains, new S&P 500 record highs, and a VIX back below 20 collectively paint a picture of a market that has, for now, moved past the worst of its March anxiety; though with oil still elevated, a divided Fed, and core inflation above target, fragility remains close to the surface. The ICE BofA MOVE Index ended April at a more contained level, reflecting a degree of stabilization in rate markets following the turbulence of the prior quarter.
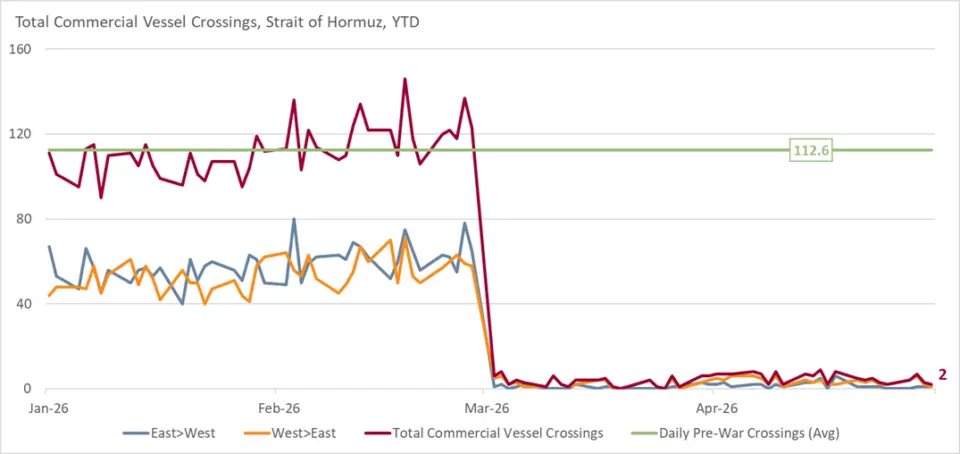
Chart of the Month – Strait of Hormuz Commercial Vessel Crossings, 2026
Vessel traffic data through the Strait of Hormuz reveals one of the most significant maritime disruptions in modern history. Daily commercial crossings, which averaged approximately 113 transits prior to the conflict, collapsed to near zero beginning in late February 2026 and have remained at effectively two crossings per day through the end of April. The magnitude and persistence of this disruption distinguish it categorically from prior Hormuz incidents—including the tanker wars of the 1980s and the 2019 Iranian seizures—which produced only temporary and partial reductions in traffic. What the data now reflects is not a shock but a structural severance.
The macroeconomic consequences of a sustained Hormuz closure are difficult to overstate. The strait serves as the transit corridor for approximately 20% of global petroleum liquids and most Qatari LNG exports, which supply critical energy infrastructure across Europe and Asia. With Gulf producers effectively landlocked, global spare capacity and alternative routing options, primarily through Saudi Arabia’s East-West Pipeline and the UAE’s Habshan-Fujairah pipeline, can offset only a fraction of the displaced volume. The result is a supply shock with no near-term structural remedy, placing sustained upward pressure on Brent crude, Henry Hub natural gas, and LNG spot prices across all major trading hubs.
For investors, the implications span multiple asset classes and time horizons. Energy equities with exposure to non-Gulf production, including North American shale, Norwegian offshore, and West African operators, stand to benefit materially from a prolonged price floor. Conversely, energy-intensive industries including airlines, shipping, petrochemicals, and bulk manufacturing face significant margin compression. At the macro level, the inflationary impulse from sustained elevated energy costs complicates the monetary policy outlook in both the U.S. and the eurozone, potentially delaying further rate cuts and extending pressure on rate-sensitive sectors including real estate and long-duration fixed income. Portfolios should be evaluated for their implicit energy price sensitivity, as this disruption has the characteristics of a persistent regime shift rather than a transitory spike.
Quote of the Month
“Oil is the currency of power.” — Henry Kissinger
Major Asset Class Dashboard
Curated by Julien Frazzo, Deputy Chief Investment Officer, and Michael G. Dow, CAIA, CFA®, Chief Investment Officer.
Related Links
You’re Invited: Macro & Markets: May 2026 – An Update from Chief Investment Officer, Michael G. Dow
Beacon ‘Pointe of View’ – A Market Update April 2026
Important Disclosure: The information contained in this article is for general informational purposes only. Opinions referenced are as of the publication date and may be modified due to changes in the market or economic conditions and may not necessarily come to pass. Forward-looking statements cannot be guaranteed. Past performance is not a guarantee of future results. Beacon Pointe has exercised all reasonable professional care in preparing this information. The information has been obtained from sources we believe to be reliable; however, Beacon Pointe has not independently verified or attested to the accuracy or authenticity of the information. The discussions, outlook, and viewpoints featured are not intended to be investment advice and do not consider specific investment objectives or risk tolerance you may have. All investments involve risks, including the loss of principal. Consult your financial professional for guidance specific to your circumstances. This document has been prepared with the assistance of Microsoft Copilot, an AI-powered tool designed to enhance productivity and provide support in drafting, editing, and organizing content. Microsoft Copilot leverages advanced AI models to generate text based on user input. Although Copilot generates original content based on user input, there is a risk that the generated text may inadvertently resemble existing works that may not be properly cited.