The Quick Facts
- U.S. equities declined sharply, with the S&P 500 down 5.0% in March (-4.4% YTD) and the Nasdaq 100 down 4.8% (-5.8% YTD), pressured by AI valuation concerns, tariff uncertainty, and escalating geopolitical tensions.
- International equities pulled back more than 10% in March but maintained YTD outperformance, with the MSCI Europe, Australasia, and Far East (“EAFE”) Index down 1.1% YTD and the MSCI Emerging Markets (“EM”) Index down 0.2% YTD, supported by dollar weakness and commodity strength.
- Fixed income reversed February’s gains as yields rose, with the 10-year Treasury closing March at 4.32% and the U.S. Aggregate (“AGG”) down 1.8% in March, leaving core bonds flat YTD.
- Federal Reserve (“Fed”) policy uncertainty and persistent inflation remained key themes, while rising geopolitical tensions and fading rate-cut expectations contributed to increased market volatility and stagflation concerns.
- Commodities diverged sharply, with WTI oil surging (+51.3% in March, +76.6% YTD) on supply risks, while gold declined (-11.6% in March) but remained positive YTD (+8.1%) amid higher real yields and a stronger dollar.
* * *
U.S. equities endured a difficult first quarter, with the S&P 500 posting its worst quarterly performance since Q3 2022, declining 5.0% in March and 4.4% YTD. Investors faced a volatile backdrop driven by tariff uncertainty, renewed concerns around AI valuations, and growing unease in private credit markets. Market anxiety intensified in March as escalating Middle East tensions revived stagflation concerns, while expectations for near-term Fed rate cuts continued to fade. The Nasdaq 100 underperformed the S&P 500, falling 4.8% in March and 5.8% YTD, as pressure in software and semiconductor stocks persisted. Elevated expectations around AI monetization and earnings durability continued to face scrutiny, prompting multiple compressions across segments of the Technology sector. Hopes of de-escalation helped drive a strong rally on March 31, but that rebound only partially offset what was otherwise a challenging month and quarter for investors.
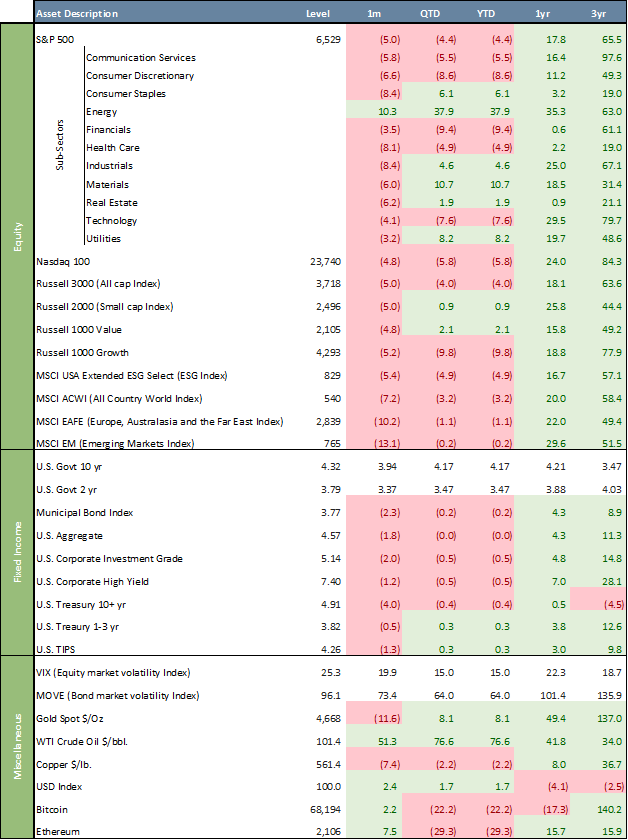
March Asset Class Performance

Performance beneath the surface remained highly dispersed. Energy was the clear standout, rising 10.3% in March and 37.9% YTD, benefiting from the sharp rise in oil prices tied to geopolitical risk. Defensive sectors such as Utilities held up relatively well amid the broader risk-off environment. By contrast, growth-oriented and cyclical sectors lagged, with Consumer Discretionary down 6.6% in March and 8.6% YTD. The broader shift highlighted continued de-risking and rotation away from high-beta exposures. Smaller caps showed relative resilience on a YTD basis despite a weak month, with the Russell 2000 down 5.0% in March but still up 0.9% YTD. Large Cap Value stocks outperformed Large Cap Growth stocks, with the Russell 1000 Value Index down 4.8% in March (+2.1% YTD), compared to a 5.2% loss for the Russell 1000 Growth Index (-9.8% YTD). Over the past three years, Value has trailed Growth by 28.7%. The ESG segment, as measured by the MSCI USA ESG Select Index, was down 5.4% in March (-4.9% YTD), trailing the S&P 500 by 0.5% YTD. Over three years, the ESG index appreciated 57.1%, underperforming the S&P 500 by 8.4%. International equities gave back some ground in March but continued to outperform U.S. large caps YTD, with the MSCI EAFE Index down 10.2% in March and 1.1% YTD, and the MSCI EM Index down 13.1% in March and 0.2% YTD, supported earlier in the quarter by a weaker U.S. dollar and stronger performance in commodity-linked and value sectors.
Fixed income reversed February’s strength as inflation concerns tied to the energy shock pushed yields higher. U.S. Treasuries sold off meaningfully, with the 10-year yield rising to 4.32% at the end of March, up from 3.94% the prior month, while the 2-year yield increased to 3.79%. Bonds broadly declined, with the Municipal Bond Index down 2.3%, the U.S. Aggregate down 1.8%, and Investment Grade Corporates down 2.0% in March, leaving all segments in negative territory YTD. Higher-carry credit held up relatively better, with High Yield down 1.2% in March and remaining the strongest fixed income segment over the trailing year at +7.0%. Credit spreads widened modestly but remained contained. At its March 17–18 meeting, the Fed left policy unchanged, noting inflation remained “somewhat elevated.” The latest CPI data showed headline inflation at 2.4% year-over-year and core CPI at 2.5%, reinforcing the market’s sensitivity to persistent price pressures and complicating the outlook for monetary policy. Since then, the Fed has emphasized a wait-and-see stance, acknowledging that rising oil prices from the Iran conflict could add near-term inflation pressure, but signaling it will not adjust policy unless those pressures prove persistent and broaden across the economy.
On the macroeconomic front, March was defined by a sharp escalation in geopolitical risk, particularly surrounding U.S./Iran tensions, which contributed to a powerful energy shock and renewed stagflation concerns. The evolving geopolitical landscape, combined with tariff uncertainty and shifting policy expectations, produced broad-based volatility across asset classes and a weaker quarter-end backdrop for most risk assets. Policy uncertainty remained elevated, with trade developments and institutional considerations continuing to influence investor sentiment and asset allocation decisions.
Commodities experienced some of the most dramatic moves during the month. WTI crude oil surged to $101.4 per barrel, rising 51.3% in March and 76.6% YTD, as markets priced in significant supply disruption risks tied to Middle East tensions and the Strait of Hormuz. In contrast, gold declined 11.6% in March, though it remained up 8.1% YTD, as a stronger U.S. dollar and rising real yields offset safe-haven demand. The U.S. Dollar Index increased 2.4% in March and 1.7% YTD, reversing earlier weakness and weighing on international asset performance at the margin. Cryptocurrency markets were mixed, with Bitcoin gaining 2.2% in March but remaining down 22.2% YTD, while Ethereum rose 7.5% in March but remained down 29.3% YTD.
The VIX, the so-called “fear gauge,” moved sharply higher throughout March, reflecting a significant pickup in equity market volatility amid escalating geopolitical tensions and macroeconomic uncertainty. After beginning the quarter at relatively subdued levels, volatility accelerated meaningfully in March, with the VIX experiencing multiple spikes. including brief moves above 30, and trending higher into quarter-end, finishing March at 25.3. This marks a clear shift from the more benign volatility regime observed earlier in the year and signals increased fragility in investor sentiment. Meanwhile, the ICE BofA MOVE Index, which tracks U.S. Treasury market volatility, also spiked in March, ending the quarter at 96.1 and reflecting continued instability in rate markets driven by shifting inflation expectations and policy uncertainty.
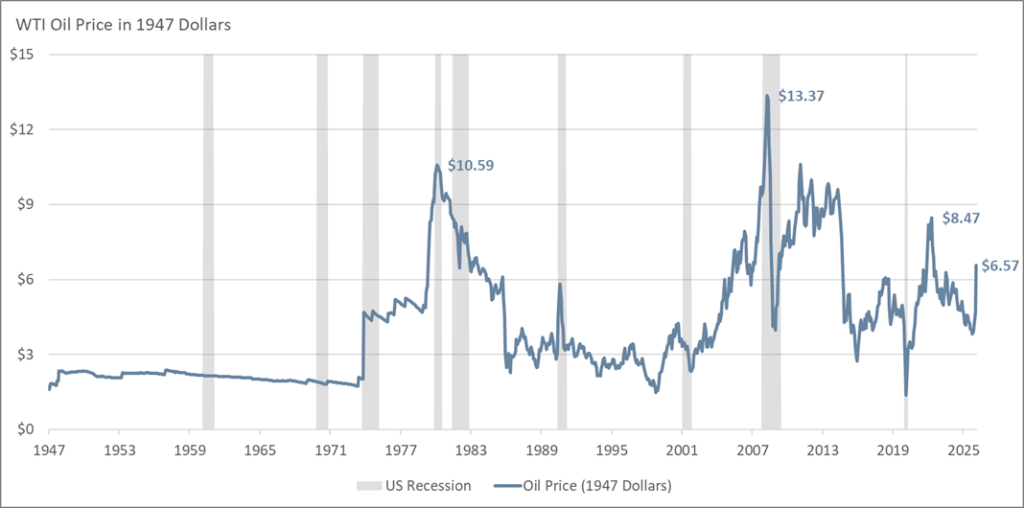
Chart of the Month – WTI Oil Price in 1947 Dollars
The chart of inflation-adjusted WTI oil prices highlights an important but often overlooked point: oil is not overly expensive by historical standards. While nominal prices today may appear high, adjusting for inflation shows that current levels, roughly $6.5 in 1947 dollars, are well below past peaks. By comparison, oil prices surged to over $10 in real terms during the late 1970s and early 1980s and reached an even higher peak of about $13.4 in 2008. In other words, today’s oil prices are significantly lower in real purchasing power terms than during some of the most economically disruptive energy shocks of the past half-century.
This perspective helps reframe common narratives about energy costs and economic strain. The oil shocks of the 1970s, driven by geopolitical disruptions like the OPEC embargo and the Iranian Revolution, imposed a far greater burden on consumers and businesses than current prices do. Similarly, the 2008 spike reflected a combination of strong global demand and supply constraints that pushed real prices to their highest levels in modern history. Against that backdrop, today’s oil market, despite periodic volatility, appears relatively moderate.
The chart also challenges the widely held assumption that high oil prices are closely tied to U.S. recessions. While some downturns have coincided with or followed major oil price spikes, the relationship is inconsistent. For example, the sharp increase in oil prices leading up to 2008 did precede a recession, but other periods of elevated prices, such as the early 2010s, did not result in economic contraction. Conversely, several recessions, including those in 2001 and 2020, occurred when oil prices were stable or even falling.
Ultimately, the data suggest that oil prices alone are neither a reliable predictor nor a primary driver of recessions. Modern economic downturns are shaped by a wide range of factors, including financial conditions, monetary policy, and external shocks. At the same time, the U.S. economy has become less energy-intensive over time, reducing its vulnerability to oil price fluctuations. Taken together, these trends underscore a more nuanced reality: while oil still matters, its role in driving economic cycles is far less dominant than it once was.
Quote of the Month
“Inflation is always and everywhere a monetary phenomenon…but supply shocks like oil can trigger it.” – Milton Friedman
Major Asset Class Dashboard
Curated by Julien Frazzo, Deputy Chief Investment Officer, and Michael G. Dow, CAIA, CFA®, Chief Investment Officer.
Related Links
You’re Invited: Macro & Markets: May 2026 – An Update from Chief Investment Officer, Michael G. Dow
Beacon ‘Pointe of View’ – A Market Update March 2026
Important Disclosure: The information contained in this article is for general informational purposes only. Opinions referenced are as of the publication date and may be modified due to changes in the market or economic conditions and may not necessarily come to pass. Forward-looking statements cannot be guaranteed. Past performance is not a guarantee of future results. Beacon Pointe has exercised all reasonable professional care in preparing this information. The information has been obtained from sources we believe to be reliable; however, Beacon Pointe has not independently verified or attested to the accuracy or authenticity of the information. The discussions, outlook, and viewpoints featured are not intended to be investment advice and do not consider specific investment objectives or risk tolerance you may have. All investments involve risks, including the loss of principal. Consult your financial professional for guidance specific to your circumstances. This document has been prepared with the assistance of Microsoft Copilot, an AI-powered tool designed to enhance productivity and provide support in drafting, editing, and organizing content. Microsoft Copilot leverages advanced AI models to generate text based on user input. Although Copilot generates original content based on user input, there is a risk that the generated text may inadvertently resemble existing works that may not be properly cited.