* * *
The Quick Facts
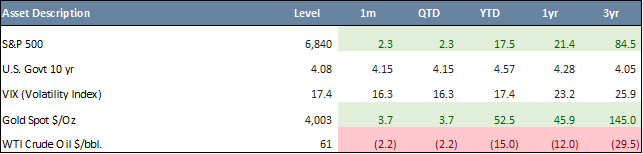
- U.S. large-cap tech and AI stocks led gains in October, with the S&P 500 up 2.3% and Nasdaq 4.8%, while smaller and cyclical names lagged.
- U.S. markets rose for a sixth straight month in October. YTD gains remain strong (S&P 500 +17.5%, Nasdaq +23.8%), although Emerging Markets (“EM”) (+32.9%) and Europe, Australasia, and the Far East (“EAFE”) (+27.3%) continue to lead on U.S. dollar weakness.
- The U.S. government shutdown delayed economic data, slowing visibility on inflation and growth.
- The Federal Reserve (“Fed”) cut rates by 25 bps to 3.75–4.00% for a second consecutive month, citing softer labor data and moderating inflation, but signaled caution on further cuts amid divided policymaker views.
- Nvidia reached $5 trillion market cap, marking a historic milestone driven by AI and data-center leadership.
- The VIX Index spiked briefly to 29 due to U.S.-China trade tensions, but closed at 17.4, below its 30-year average.
Equities posted solid gains, led once again by large-cap tech and AI-related stocks. The S&P 500 (+2.3%) and Nasdaq (+4.8%) hit new highs as investors welcomed softer trade policies and strong earnings from the Magnificent Seven. Gains, however, remained narrow-breadth, as smaller and cyclical names lagged. YTD, the S&P 500 is up 17.5% and the Nasdaq 23.8%, reflecting a strong rebound from early-year jitters. EM, as measured by the MSCI EM Index, and EAFE, as measured by the MSCI EAFE Index, remain ahead of U.S. equities with YTD returns of 32.9% and 27.3%, respectively, partly helped by a weakening U.S. dollar.
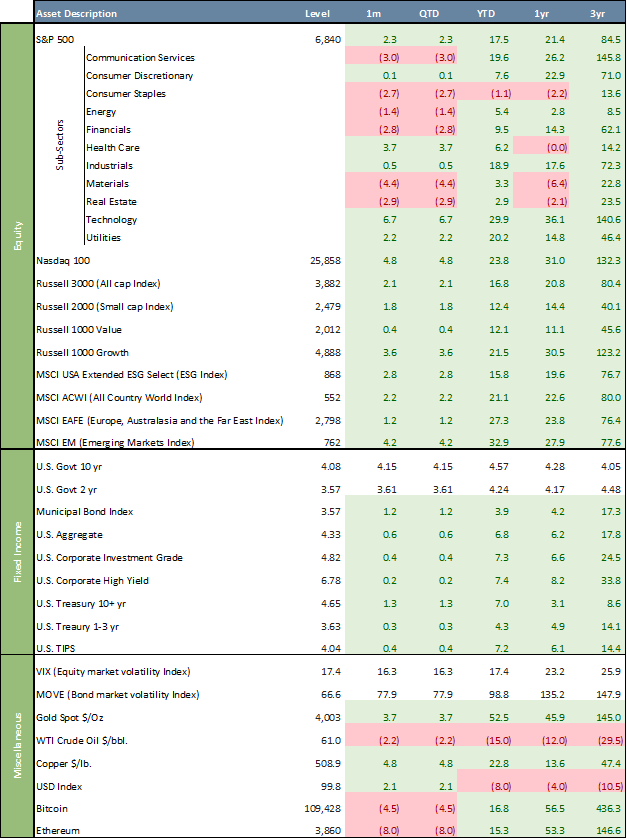
Global Industry Classification Standard (“GICS”) sectors’ performances were mixed in October. Information Technology (+6.7%) led among sectors while Communication Services (-3.0%) and Materials (-4.4%) lagged. Year-to-date, all but one GICS sectors are in the green, with one sector clearly outperforming, Information Technology up +29.9% and Consumer Staples down 1.1%. Over the past three years, Communications has had the best performance with a 145.8% total return, closely followed by Information Technology at 140.6%.
October Asset Class Performance
Large Cap Value stocks underperformed Large Cap Growth stocks, with the Russell 1000 Value Index up 0.4% in October (+12.1% YTD), compared to a 3.6% gain for the Russell 1000 Growth Index (+21.5% YTD). Over the past three years, Value has trailed Growth by 77.5%. Nvidia became the first company in history to surpass a $5 trillion market capitalization, reflecting an extraordinary surge in investor demand for its AI‑related products and data‑center technologies. The ESG segment, as measured by the MSCI USA ESG Select Index, rose 2.8% in October (+15.8% YTD), trailing the S&P 500 by 1.7% YTD. Over three years, the ESG index appreciated 76.7%, underperforming the S&P 500 by 8.1%.
On the macro side, the U.S. government shutdown delayed most data releases, complicating the Fed’s inflation tracking. Job growth slowed, wage pressures eased, and inflation remained “somewhat elevated” but trending lower. Global factors, including U.S.-China trade frictions and cautious risk sentiment, added uncertainty. Meanwhile, the government shutdown that began October 1, 2025, suspended many federal data releases and furloughed hundreds of thousands of workers — adding to the risk that some economic losses may become permanent while policymakers and markets operate with reduced visibility.
Much of the global market narrative of October continued to center around the Fed. The central bank cut rates by 25 basis points to a range of 3.75 % – 4.00 %, a back-to-back cut following 25 basis points at the September meeting. Policymakers cited softer labor data and moderating inflation but stopped short of signaling another cut in December. The message was cautious. The Fed wants to support growth without reigniting price pressures. Fed officials were sharply divided, with a dovish side pressing for quicker or larger rate cuts to support a weakening labor market, while the cautious side prioritized containing sticky inflation and favored a slower pace of easing.
In Treasuries, yields moved unevenly. The front end sold off slightly after the Fed’s statement tempered rate-cut hopes, while longer maturities rallied earlier in the month on growth concerns. The 10-year U.S. Treasury yield ended the month at 4.08%, down from 4.15% in September and well below its October 2023 peak of 4.99%, reflecting expectations for a softer economy and potential further easing. The 2-year yield closed at 3.57%, versus 3.61% at the end of September. Notably, the yield curve dis-inverted in September 2024, with the 10-year now 50 basis points above the 2-year. Bonds continued to gain on Fed rate cuts, declining real yields, and safe-haven demand amid macro and fiscal uncertainty. The rally was broad-based, with the Bloomberg U.S. Aggregate Bond Index (AGG) up 0.6% in October (6.8% YTD), municipal bonds up 1.2% (3.9% YTD), investment-grade corporates up 0.4% (7.3% YTD), and high-yield bonds up 0.2% (7.4% YTD).
In October, gold advanced another 3.7% to a record $4,003/oz (+52.5% YTD), reinforcing its role as a hedge against fiat currencies. The rally in gold is driven by weakening U.S. real yields, a softer dollar, and safe-haven demand amid geopolitical and macro uncertainty. Oil (WTI crude) fell another 2.2% to $61.0/bbl., bringing its YTD decline to 15.0%. In digital assets, Bitcoin lost 4.5% in October (+16.8% YTD), while Ethereum slipped 8.0% (+15.3% YTD).
The U.S. Dollar Index (DXY) was up 2.1% in October, reducing its YTD decline at 8.0%, helped by lower market expectations for additional Fed rate cuts and concerns over political interference potentially undermining central bank independence. A weaker DXY enhances U.S. dollar returns on non-U.S. equities, making international stocks more appealing to U.S. investors.
October saw a short-lived spike of volatility to 29 as a result of a sharp uptick in trade-war rhetoric between the U.S. and China, including threats of massive increases of tariffs. The VIX, the so-called “fear gauge,” closed October at 17.4, below its 30-year average of ~20. Meanwhile, the ICE BofA MOVE Index, which tracks U.S. Treasury market volatility, fell further to 66.6, its lowest level since 2021 after spiking to 140 in early April. Extended periods of low VIX often signal investor complacency, suggesting markets may be priced for perfection and could be vulnerable to sudden spikes in volatility.
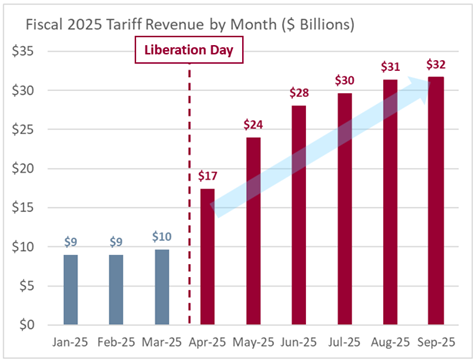
Chart of the Month – Tariff Revenue by Month
The graph shows the amount of tariff revenue collected by the U.S. each month. From the graph, you can see that tariff revenue was relatively steady at approximately $10 billion a month, then surged sharply following the “Liberation Day” announcement.
The “Liberation Day” announcement refers to a significant economic policy shift introduced by President Donald Trump on April 2, 2025. During a White House Rose Garden ceremony, President Trump declared a national emergency over the U.S. trade deficit and signed an executive order, implementing a broad package of import duties aimed at rectifying what he described as unfair trade practices by other nations.
The sudden jump in tariff revenue highlights how quickly the new tariff measures increased government collections. The trend line suggests that, if the high monthly levels continue, the annualized revenue would be around $360 billion. However, earlier months also show that revenue can fluctuate significantly depending on import activity and policy changes, so sustained high levels are not guaranteed.
While that represents a major increase from previous years, it still accounts for only a small share of total federal receipts, which reached about $5.2 trillion in fiscal year 2025, and an even smaller portion of the $1.8 trillion federal deficit.
Tariffs have become a significant new source of revenue, but they remain modest compared with the scale of the nation’s overall finances and borrowing needs.
Quote of the Month
“When someone says, ‘Let’s impose tariffs on foreign imports,’ it looks like they’re doing the patriotic thing by protecting American products … But the truth is, high tariffs inevitably lead to retaliation by foreign countries and the triggering of fierce trade wars.” – Ronald Reagan
Major Asset Class Dashboard
Curated by Julien Frazzo, Deputy Chief Investment Officer and Michael G. Dow, CAIA, CFA®, Chief Investment Officer
RELATED LINKS
Beacon ‘Pointe of View’ – A Market Update October 2025
Important Disclosure: The information contained in this article is for general informational purposes only. Opinions referenced are as of the publication date and may be modified due to changes in the market or economic conditions and may not necessarily come to pass. Forward-looking statements cannot be guaranteed. Past performance is not a guarantee of future results. Beacon Pointe has exercised all reasonable professional care in preparing this information. The information has been obtained from sources we believe to be reliable; however, Beacon Pointe has not independently verified or attested to the accuracy or authenticity of the information. The discussions, outlook, and viewpoints featured are not intended to be investment advice and do not consider specific investment objectives or risk tolerance you may have. All investments involve risks, including the loss of principal. Consult your financial professional for guidance specific to your circumstances. This document has been prepared with the assistance of Microsoft Copilot, an AI-powered tool designed to enhance productivity and provide support in drafting, editing, and organizing content. Microsoft Copilot leverages advanced AI models to generate text based on user input. Although Copilot generates original content based on user input, there is a risk that the generated text may inadvertently resemble existing works that may not be properly cited.