The Quick Facts
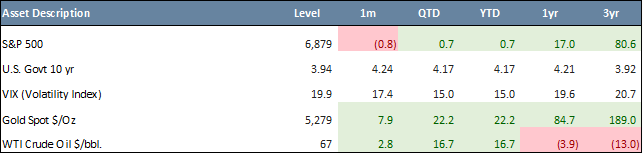
- U.S. equities were volatile in February, with the S&P 500 declining 0.8%, its first monthly loss in three months, while the Nasdaq 100 fell 2.3% as AI-linked valuations repriced and geopolitical tensions intensified.
- Non-U.S. equities continued to outperform year-to-date, with the MSCI Europe, Australasia, and Far East (“EAFE”) Index up 10.1% and the MSCI Emerging Markets (“EM”) Index up 14.8%, supported by earlier dollar softness and strength in value sectors.
- Fixed income rallied on flight-to-safety flows, with the Bloomberg U.S. Aggregate Bond (“AGG”) Index rising 1.6% and the 10-year Treasury yield falling to 3.94% as growth expectations recalibrated.
- Federal Reserve (“Fed”) uncertainty and persistent inflation pressures remained central to market narratives, alongside escalating U.S./Iran tensions and new tariff measures to counter the ones struck down by the Supreme Court.
- Commodities advanced amid geopolitical stress, with WTI crude up 16.7% YTD to $67 per barrel and gold surging 22.2% YTD to $5,270 per ounce, while volatility increased modestly with the CBOE Volatility Index (“VIX”) averaging 19 during February.
* * *
U.S. equities endured a challenging February, with the S&P 500 posting its first monthly decline in three months (–0.8%), reflecting broad risk-off positioning amid geopolitical escalation, sticky inflation data, and concerns that AI-linked valuations had run ahead of fundamentals. The Nasdaq 100 underperformed more sharply (down 2.3%), as pressure in software and semiconductor stocks weighed on performance. Elevated expectations around AI monetization and earnings durability faced renewed scrutiny, prompting multiple compressions across segments of the Technology sector.
International equities continued to outperform. EAFE and EM equities posted YTD gains of 10.1% and 14.8%, respectively, versus +0.7% YTD for the S&P 500. A softer U.S. dollar earlier in the year and relatively stronger performance in commodity-linked and value sectors supported the divergence.
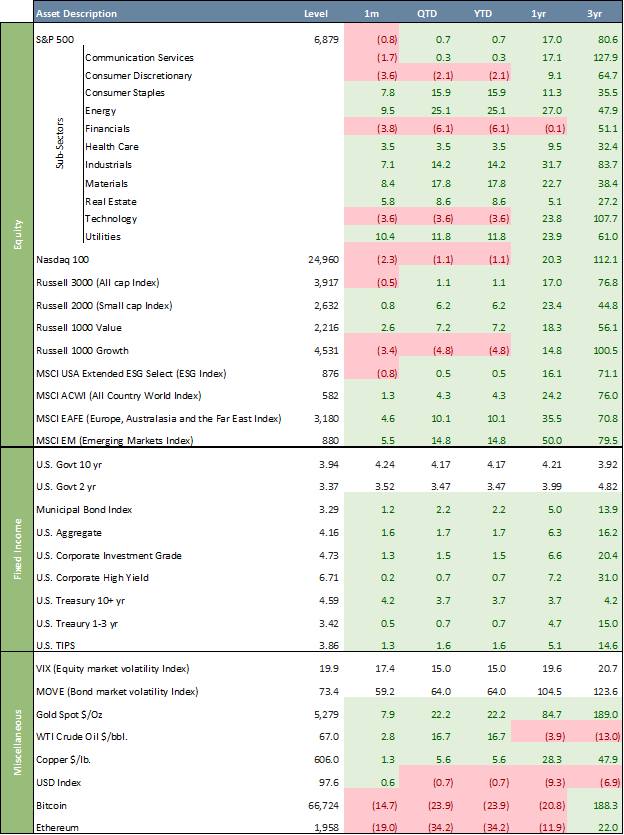
February Asset Class Performance
U.S. equity sector performance was notably defensive. Utilities led with a 10.4% gain, benefiting from falling Treasury yields and rotation into lower-volatility exposures. By contrast, Communication Services, Financials and Technology each declined by more than 3.5% during the month. The shift marked a clear reversal from January’s cyclical leadership and highlighted a broader de-risking across equity markets. The Russell 2000 (small caps) Index outperformed with a 0.8% gain. Large Cap Value stocks outperformed Large Cap Growth stocks, with the Russell 1000 Value Index up 2.6% in February (+7.2% YTD), compared to a 3.4% loss for the Russell 1000 Growth Index (-4.8% YTD). Over the past three years, Value has trailed Growth by 44.4%. The ESG segment, as measured by the MSCI USA ESG Select Index, was down 0.8% in February (+0.5% YTD), trailing the S&P 500 by 0.2% YTD. Over three years, the ESG index appreciated 71.1%, underperforming the S&P 500 by 9.1%.
U.S. Treasuries rallied meaningfully in February, with strong demand pushing yields lower amid flight-to-safety flows and recalibration of growth expectations. The 10-year Treasury yield retreated below 4.0% during the month, reflecting geopolitical risk premiums and renewed demand for duration. The 10-year U.S. Treasury yield ended February at 3.94%, from 4.17% at the end of December and well below its October 2023 peak of 4.99%. The 2-year yield closed at 3.37%, versus 3.47% at the end of December. The yield curve dis-inverted in September 2024, with the 10-year now 57 basis points above the 2-year. Core bonds outperformed higher-beta credit. The AGG gained 1.6% in February, while high-yield bonds rose just 0.2%, indicating more selective risk appetite. Credit spreads widened modestly but remained contained relative to historical stress episodes. Inflation-linked indicators sent mixed signals, as Producer Price Index (“PPI”) readings and broader inflation data suggested that underlying price pressures remain persistent, complicating the forward path for monetary policy.
The Fed did not hold a policy meeting in February (the next FOMC meeting is scheduled for March 17–18). Nonetheless, Fed policy debates and leadership considerations remained politically charged and central to market narratives. Ongoing institutional autonomy concerns and questions around the future direction of monetary policy continued to influence rate expectations and asset allocation decisions.
On the macroeconomic front, February was dominated by far-reaching geopolitical developments, most notably escalating U.S./Iran tensions following a coordinated U.S./Israeli strike on Iranian targets. The episode significantly reinforced global risk-off positioning and buoyed traditional safe havens, including Treasuries and gold. In parallel, a new U.S. tariff regime took effect in late February. A 10% global tariff announcement, subsequently raised to 15%, introduced another layer of trade uncertainty, weighing on global growth expectations and adding complexity to inflation forecasts. In a major ruling on presidential power, the Supreme Court struck down the sweeping tariffs that President Trump imposed in a series of executive orders. The justices ruled that the tariffs exceed the powers given to the president by Congress under a 1977 law providing him the authority to regulate commerce during national emergencies created by foreign threats. The court did not weigh in, however, on whether or how the federal government should provide refunds to the importers who have paid the tariffs, estimated in 2025 at more than $200 billion.
Oil prices continued to climb, with WTI crude reaching $67 per barrel (+16.7% YTD). Both Brent and WTI advanced toward multi-month highs as markets priced in escalating Middle East tensions and supply disruption risks, particularly around the Strait of Hormuz. Gold extended its powerful rally, now up 22.2% YTD. Safe-haven demand accelerated amid intensifying geopolitical stress and persistent inflation concerns, reinforcing investor demand for real assets and portfolio hedges. The U.S. Dollar Index (“DXY”) was up 0.6% in February, decreasing its 12-month decline to 9.3%. A weaker DXY enhances U.S. dollar returns on non-U.S. equities, making international stocks more appealing to U.S. investors.
The VIX, the so-called “fear gauge,” started the month relatively calm around the mid-14s then climbed through the month as markets faced geopolitical and macroeconomic uncertainty, averaging 19 for February, below its 30-year average of ~20. Meanwhile, the ICE BofA MOVE Index, which tracks U.S. Treasury market volatility, ended February at 73.4, its highest level in 2026.
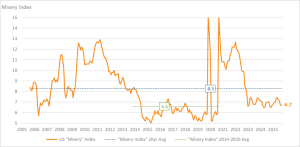
Chart of the Month – The Misery Index
The Misery Index is a simple economic measure calculated by adding the inflation rate to the unemployment rate. It was created in the 1960s by economist Arthur Okun as a quick way to capture the level of economic discomfort facing the average person. The logic is straightforward: high unemployment makes it hard to find work, while high inflation erodes purchasing power. When both are elevated, economic “misery” increases.
The Misery Index is often used as a rough indicator of how well the Fed is managing its dual mandate: price stability and maximum employment. Because the index simply adds inflation and unemployment together, it directly reflects the two variables the Fed is tasked with balancing. If both inflation and unemployment are low, the Misery Index will also be low, suggesting the Fed is broadly succeeding in its objectives.
Historically, spikes in the Misery Index have coincided with periods when monetary policy faced significant challenges. As of early 2026 in the U.S., the Misery Index is 6.7%, reflecting moderate inflation combined with relatively low unemployment. By historical standards, this is below the 20-year average and suggests that overall economic stress is not severe compared to past crisis periods. The Misery Index being low means the Fed is broadly on track, but economists still check deeper measures like wage growth, labor force participation and inflation expectations before saying the mandate is fully achieved.
While the Misery Index is useful for its simplicity, it has limitations. It does not account for income inequality, underemployment, regional economic disparities, or differences in how inflation affects various households. For example, rising housing or healthcare costs may create significant financial strain even if overall inflation appears moderate. As a result, policymakers and economists treat the Misery Index as a starting point rather than a comprehensive measure of economic well-being.
Quote of the Month
“There is always a temporary trade-off between inflation and unemployment; there is no permanent trade-off.” – Milton Friedman
Major Asset Class Dashboard
Curated by Julien Frazzo, Deputy Chief Investment Officer, and Michael G. Dow, CAIA, CFA®, Chief Investment Officer.
Related Links
Beacon ‘Pointe of View’ – A Market Update February 2026
Beacon ‘Pointe of View’ – A Market Update January 2026
Important Disclosure: The information contained in this article is for general informational purposes only. Opinions referenced are as of the publication date and may be modified due to changes in the market or economic conditions and may not necessarily come to pass. Forward-looking statements cannot be guaranteed. Past performance is not a guarantee of future results. Beacon Pointe has exercised all reasonable professional care in preparing this information. The information has been obtained from sources we believe to be reliable; however, Beacon Pointe has not independently verified or attested to the accuracy or authenticity of the information. The discussions, outlook, and viewpoints featured are not intended to be investment advice and do not consider specific investment objectives or risk tolerance you may have. All investments involve risks, including the loss of principal. Consult your financial professional for guidance specific to your circumstances. This document has been prepared with the assistance of Microsoft Copilot, an AI-powered tool designed to enhance productivity and provide support in drafting, editing, and organizing content. Microsoft Copilot leverages advanced AI models to generate text based on user input. Although Copilot generates original content based on user input, there is a risk that the generated text may inadvertently resemble existing works that may not be properly cited.