* * *
The Quick Facts
- U.S. equities were volatile in early November, but a late month rebound driven by rising expectations for a December Federal Reserve (“Fed”) rate cut helped the S&P 500 finish up 0.2%.
- Large Cap Value outperformed Large Cap Growth in November (+2.7% vs. -1.8%).
- YTD, the S&P 500 is up +17.8%, the Nasdaq +21.8%, while Emerging Markets (“EM”) (+29.7%) and Europe, Australasia, and the Far East (“EAFE”) (+28.2%) remain ahead.
- Economic data returned after a 43-day shutdown, showing mixed labor signals and weak consumer sentiment.
- Treasury yields declined, with the 10-year at 4.01% and the 2-year at 3.49%, while bonds rallied across the board.
- Gold surged 5.9% to $4,239/oz, oil fell 4%, and crypto extended losses (Bitcoin -16.7%, Ethereum -21.7%).
- Volatility spiked briefly to 28, but the CBOE Volatility Index (“VIX”) closed at 16.4, below its 30-year average, while Treasury volatility stabilized near multi-year lows.
A new record-long government shutdown, concerns over elevated valuations, and hawkish sentiment from the Fed rattled U.S. equity markets in the first half of November. But a sharp rise in expectations for a December Fed rate cut led to a strong turnaround for the S&P 500 in the last week of the month, with the index finishing November up 0.2%. YTD, the S&P 500 is up 17.8% and the Nasdaq 21.8%, reflecting a strong rebound from early-year jitters. EM, as measured by the MSCI EM Index, and EAFE, as measured by the MSCI EAFE Index, remain ahead of U.S. equities with YTD returns of 29.7% and 28.2%, respectively, partly helped by a weakening U.S. dollar. Performance among large-cap Global Industry Classification Standard (“GICS”) was mixed in November. Health Care had its best month in years, surging 9.3%. In contrast, Information Technology shed 4.8% as AI-bubble fears escalated, although the sector subsequently staged a dramatic comeback towards the end of the month. Year-to-date, all GICS sectors are in the green, with Information Technology leading (+23.7%) and Consumer Staples lagging (+2.9%). Over the past three years, Communications has had the best performance with a 131.2% total return, followed by Information Technology at 115.4%.
November Asset Class Performance

Large Cap Value stocks outperformed Large Cap Growth stocks, with the Russell 1000 Value Index up 2.7% in November (+15.1% YTD), compared to a 1.8% loss for the Russell 1000 Growth Index (+19.3% YTD). Over the past three years, Value has trailed Growth by 68.9%. The ESG segment, as measured by the MSCI USA ESG Select Index, rose 0.4% in November (+16.3% YTD), trailing the S&P 500 by 1.5% YTD. Over three years, the ESG index appreciated 66.7%, underperforming the S&P 500 by 8.4%.
On the macro front, the return of economic data after the 43-day shutdown added uncertainty. Many reports were delayed or rescheduled, making it harder to gauge inflation, jobs, and growth. Labor-market signals remained mixed. Weekly jobless claims fell to a seven-month low, but overall hiring and growth showed signs of slowing, reinforcing a cautious economic outlook. Consumer sentiment fell to its lowest level since 2022.
Market participants continued to focus heavily on the Fed, following its late October 25 basis points rate cut, which brought the target range down to 3.75%–4.00%. While moderating inflation and a softening labor market justified the recent easing, Fed officials avoided signaling a clear path for another cut in December. The central bank emphasized caution, underscoring its dual mandate: supporting slowing economic growth while avoiding a resurgence of inflation. However, public comments from Fed leaders revealed a widening divide within the Committee. Dovish members argued that continued labor-market weakness warranted further near-term easing. More cautious officials maintained that sticky inflation still demanded patience. This internal split left markets struggling to price the odds of a December rate, with investors closely watching upcoming labor and inflation data to determine which faction will prevail heading into the final meeting of the year. As we go to print, the CME FedWatch, which tracks the probability of changes to the Fed rate, as implied by 30-Day Fed Funds futures prices, shows an 88% chance of a 25 basis points rate cut at the December meeting.
In Treasuries, yields moved unevenly. The 10-year U.S. Treasury yield ended the month at 4.01%, down from 4.15% in September and well below its October 2023 peak of 4.99%, reflecting expectations for a softer economy and potential further easing. The 2-year yield closed at 3.49%, versus 3.61% at the end of September. The yield curve dis-inverted in September 2024, with the 10-year now 52 basis points above the 2-year. Bonds continued to gain on Fed rate cuts, declining real yields, and safe-haven demand amid macro and fiscal uncertainty. The rally was broad-based, with the Bloomberg U.S. Aggregate Bond Index (AGG) up 0.6% in November (7.5% YTD), municipal bonds up 0.2% (4.2% YTD), investment-grade corporates up 0.7% (8.0% YTD), and high-yield bonds up 0.6% (8.0% YTD).
In November, gold advanced another 5.9% to a record $4,239/oz (+61.5% YTD), reinforcing its role as a hedge against fiat currencies. The rally in gold is driven by weakening U.S. real yields, a softer dollar, and safe-haven demand amid geopolitical and macro uncertainty. Oil (WTI crude) fell another 4.0% to $58.6/bbl., bringing its YTD decline to 18.4%. In digital assets, Bitcoin lost 16.7% in November (-2.7% YTD), while Ethereum dropped 21.7% (-9.7% YTD). The Bitcoin drawdown that began in early October continued through most of November. From peak to trough, its price declined 32%. According to data compiled by crypto manager Grayscale, Bitcoin drawdowns can be measured by their magnitude and duration, and reviewing the data suggests there are largely two types. “Cyclical drawdowns” involve deep and prolonged price declines lasting 2-3 years. Historically, these have occurred about every four years, with the last one in 2021. In contrast, “bull market drawdowns” have average price declines of 25% and last 2-3 months. These occur 3-5 times per year during bull markets. The U.S. Dollar Index (“DXY”) was down 0.3% in November, increasing its YTD decline to 8.3%. A weaker DXY enhances U.S. dollar returns on non-U.S. equities, making international stocks more appealing to U.S. investors.
November saw a short-lived spike of volatility to 28, reflecting growing investor anxiety, driven by concerns about overheated tech valuations, uncertainty over interest rates, and broader macroeconomic risks. The VIX, the so-called “fear gauge,” closed November at 16.4, below its 30-year average of ~20. Meanwhile, the ICE BofA MOVE Index, which tracks U.S. Treasury market volatility, stabilized at 69.0, close to its lowest level (65.8) since 2021 after spiking to 140 in early April.
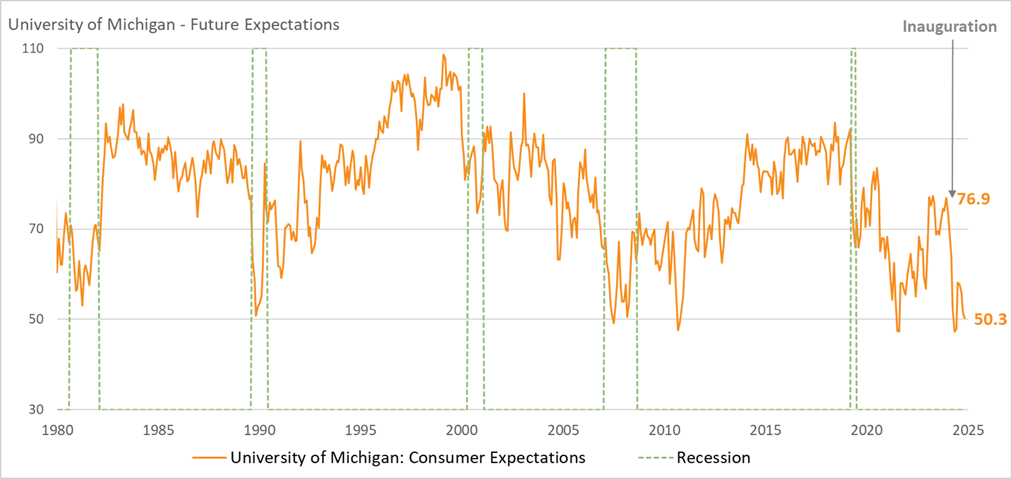
Chart of the Month – Consumer Confidence – Future Expectations
The University of Michigan’s Consumer Sentiment Survey includes the Future Expectations index, which measures how optimistic or pessimistic consumers are about the economy over the next six months. The survey asks households about anticipated business conditions, employment prospects, and personal income. Responses are categorized as positive, negative, or neutral, and the results are aggregated to produce the index number. By focusing on expectations rather than current conditions, the University of Michigan’s index captures forward-looking sentiment, providing an early signal of changes in consumer behavior.
This measure is important because consumer spending drives approximately two-thirds of economic activity in the U.S. When consumers are optimistic about the future, they are more likely to make major purchases and invest, which stimulates economic growth. Conversely, pessimistic expectations may lead to reduced spending and slower growth. Policymakers, businesses, and investors use the University of Michigan’s Future Expectations index to anticipate trends in the economy, helping guide decisions on monetary policy, business planning, and investment strategies.
Year-to-date, consumer confidence declined as uncertainty surrounding tariffs created volatility, prompting growing concerns about affordability. Shoppers and households began to feel the impact of fluctuating prices on everyday goods and services, leading to heightened caution in spending. This shift in sentiment highlights how trade policies and economic instability can directly influence consumer behavior, with affordability emerging as a key factor driving purchasing decisions.
Quote of the Month
“There is only one boss – the customer. And he can fire everybody in the company, from the chairman on down, simply by spending his money somewhere else.” – Sam Walton (Walmart and Sam’s Club founder)
Major Asset Class Dashboard

Curated by Julien Frazzo, Deputy Chief Investment Officer and Michael G. Dow, CAIA, CFA®, Chief Investment Officer
RELATED LINKS
Beacon ‘Pointe of View’ – A Market Update November 2025
Important Disclosure: The information contained in this article is for general informational purposes only. Opinions referenced are as of the publication date and may be modified due to changes in the market or economic conditions and may not necessarily come to pass. Forward-looking statements cannot be guaranteed. Past performance is not a guarantee of future results. Beacon Pointe has exercised all reasonable professional care in preparing this information. The information has been obtained from sources we believe to be reliable; however, Beacon Pointe has not independently verified or attested to the accuracy or authenticity of the information. The discussions, outlook, and viewpoints featured are not intended to be investment advice and do not consider specific investment objectives or risk tolerance you may have. All investments involve risks, including the loss of principal. Consult your financial professional for guidance specific to your circumstances. This document has been prepared with the assistance of Microsoft Copilot, an AI-powered tool designed to enhance productivity and provide support in drafting, editing, and organizing content. Microsoft Copilot leverages advanced AI models to generate text based on user input. Although Copilot generates original content based on user input, there is a risk that the generated text may inadvertently resemble existing works that may not be properly cited.